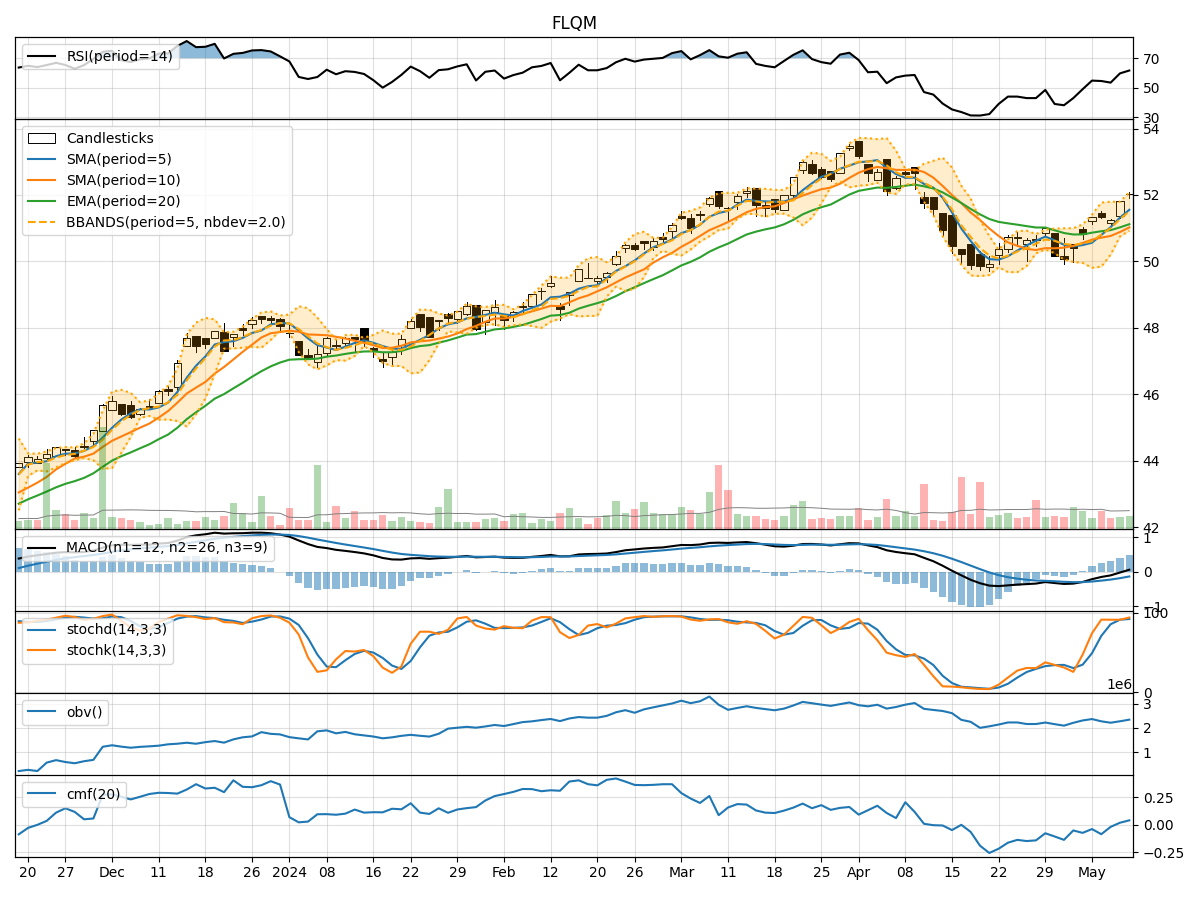
Technical Analysis of FLQM 2024-05-10
Overview:
In the last 5 trading days, FLQM stock has shown a mix of price movements and technical indicators. The stock price has fluctuated within a range, with some indicators suggesting potential bullish momentum while others indicate a possible consolidation phase. By analyzing the trend, momentum, volatility, and volume indicators, we can gain a comprehensive understanding of the stock's potential future price movement.
Trend Indicators:
- Moving Averages (MA): The 5-day Moving Average (MA) has been trending above the Simple Moving Average (SMA) and Exponential Moving Average (EMA), indicating a short-term bullish trend.
- MACD: The Moving Average Convergence Divergence (MACD) has been positive, with the MACD line above the signal line, suggesting bullish momentum.
- MACD Histogram: The MACD Histogram has been increasing, indicating strengthening bullish momentum.
Momentum Indicators:
- RSI: The Relative Strength Index (RSI) has been fluctuating but generally in the overbought territory, suggesting potential for a pullback.
- Stochastic Oscillator: Both %K and %D have been in the overbought zone, indicating a potential reversal.
- Williams %R: The Williams %R has been fluctuating around the oversold territory, signaling a potential reversal.
Volatility Indicators:
- Bollinger Bands: The Bollinger Bands have been widening, indicating increased volatility in the stock price.
- Bollinger %B: The %B indicator has been fluctuating within a range, suggesting potential price reversals.
Volume Indicators:
- On-Balance Volume (OBV): The OBV has shown mixed signals, with some days seeing positive volume accumulation and others showing distribution.
- Chaikin Money Flow (CMF): The CMF has been negative, indicating potential selling pressure.
Key Observations and Opinions:
- Trend: The trend indicators suggest a short-term bullish bias in the stock price.
- Momentum: The momentum indicators show mixed signals, with some pointing to overbought conditions and potential reversals.
- Volatility: The volatility indicators indicate increased price fluctuations, which could lead to both upside and downside movements.
- Volume: The volume indicators show mixed signals, with no clear accumulation or distribution pattern.
Conclusion:
Based on the analysis of the technical indicators, the next few days for FLQM stock could see sideways consolidation with a slight bias towards a bullish continuation. Traders should closely monitor key levels such as support and resistance to gauge the stock's direction. It is advisable to wait for confirmation from multiple indicators before making any significant trading decisions.