Technical Analysis of FMNY 2024-05-10
Overview:
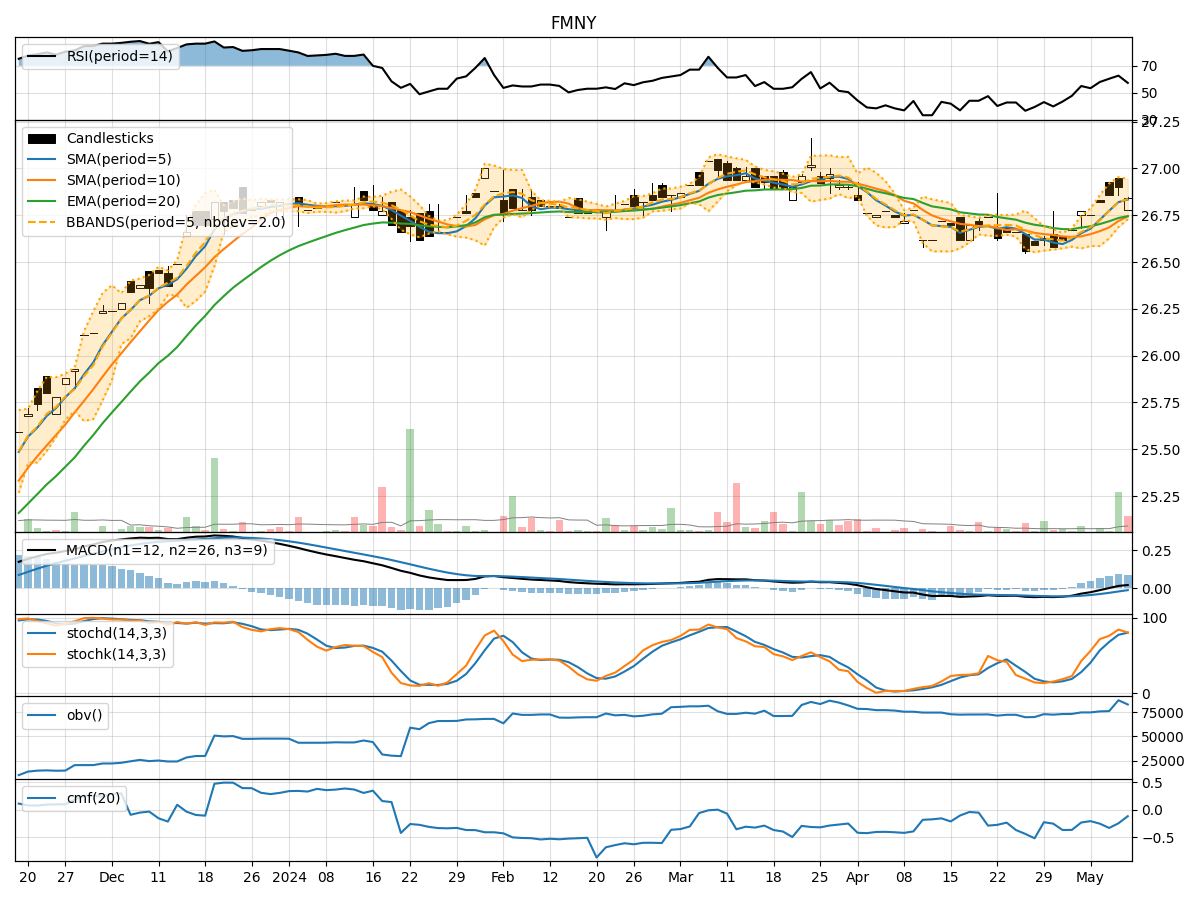
In analyzing the technical indicators for FMNY stock over the last 5 days, we will delve into the trends, momentum, volatility, and volume aspects to provide a comprehensive outlook on the possible stock price movement in the coming days. By examining key indicators such as moving averages, MACD, RSI, Bollinger Bands, and OBV, we aim to offer valuable insights and predictions for informed decision-making.
Trend Analysis:
- Moving Averages (MA): The 5-day MA has been consistently above the closing prices, indicating a short-term uptrend.
- MACD: The MACD line has been above the signal line, suggesting bullish momentum.
- EMA: The exponential moving average has been trending upwards, supporting the bullish sentiment.
Momentum Analysis:
- RSI: The RSI has been in the neutral to slightly overbought territory, indicating potential strength in the current uptrend.
- Stochastic Oscillator: Both %K and %D have been in the overbought zone, signaling a potential reversal or consolidation.
- Williams %R: The indicator has been in the oversold region, suggesting a possible reversal to the upside.
Volatility Analysis:
- Bollinger Bands: The stock price has been trading within the bands, indicating normal volatility.
- Bollinger %B: The %B value has been fluctuating around 0.5, suggesting equilibrium between buying and selling pressure.
Volume Analysis:
- On-Balance Volume (OBV): The OBV has shown mixed signals, with no clear trend in volume accumulation or distribution.
- Chaikin Money Flow (CMF): The CMF has been negative, indicating selling pressure in the market.
Key Observations:
- The stock is currently in an upward trend based on moving averages and MACD.
- Momentum indicators suggest a potential overbought condition, signaling a need for caution.
- Volatility remains stable, with no extreme fluctuations in price movements.
- Volume indicators show mixed signals, reflecting uncertainty in market participation.
Conclusion:
Based on the analysis of technical indicators, the next few days for FMNY stock could see further upside potential in the short term due to the bullish trend and momentum. However, the overbought signals from momentum indicators and the negative CMF warrant careful monitoring for a possible correction or consolidation. Traders should consider setting appropriate stop-loss levels to manage risks effectively.