Technical Analysis of FNGD 2024-05-10
Overview:
In analyzing the technical indicators for FNGD over the last 5 days, we will delve into the trend, momentum, volatility, and volume indicators to provide a comprehensive outlook on the possible stock price movement in the coming days. By examining these key aspects, we aim to offer valuable insights and predictions for informed decision-making.
Trend Analysis:
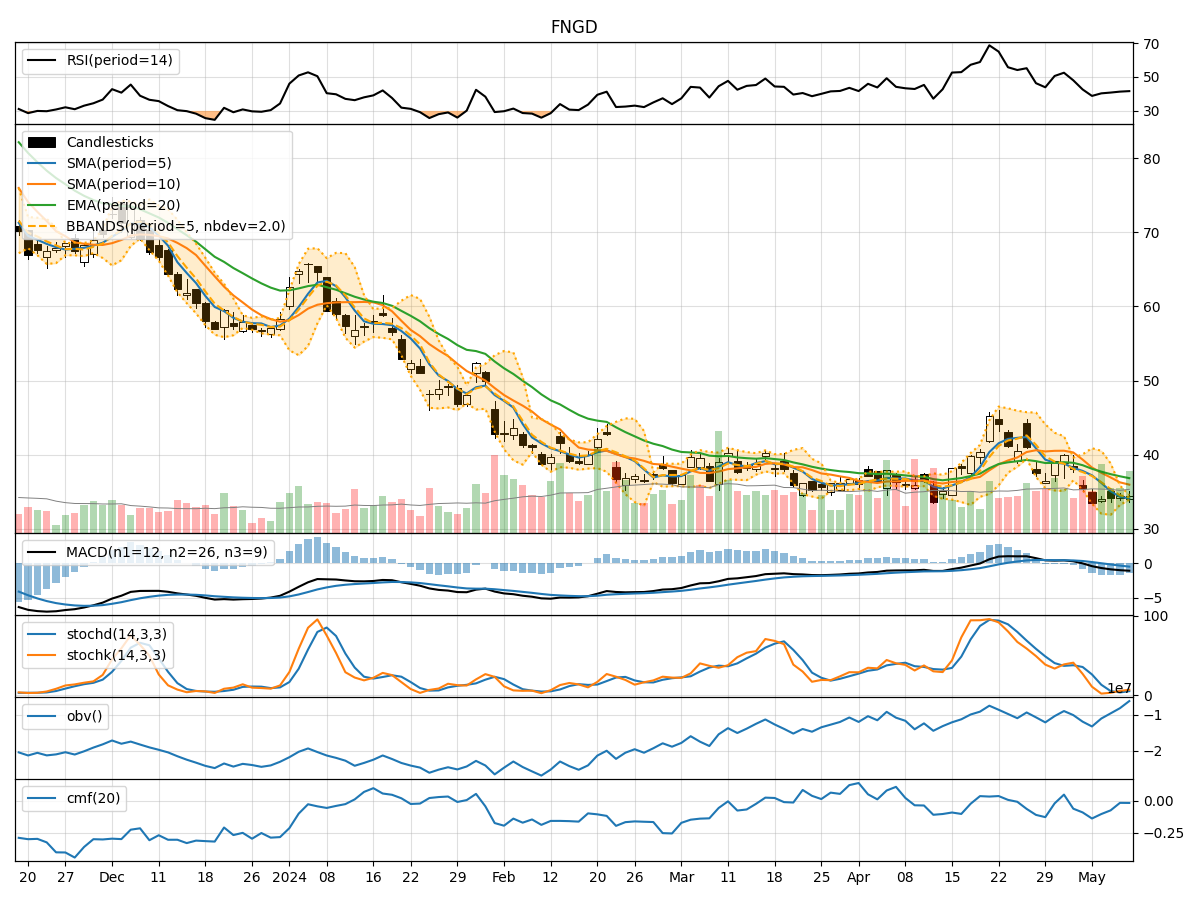
- Moving Averages (MA): The 5-day MA has been consistently below the longer-term SMAs and EMAs, indicating a downtrend in the stock price.
- MACD: The MACD line has been decreasing, with the MACD histogram showing negative values, suggesting bearish momentum.
Momentum Analysis:
- RSI: The RSI has been gradually increasing but remains below the overbought threshold, indicating neutral to slightly bullish momentum.
- Stochastic Oscillator: Both %K and %D have been rising, but they are still in the oversold region, suggesting a potential reversal.
Volatility Analysis:
- Bollinger Bands (BB): The stock price has been trading below the middle BB, indicating a lower volatility environment.
Volume Analysis:
- On-Balance Volume (OBV): The OBV has been steadily increasing, suggesting accumulation by investors.
- Chaikin Money Flow (CMF): The CMF has been negative, indicating distribution in the stock.
Key Observations:
- The trend indicators point towards a bearish sentiment in the stock price.
- Momentum indicators show a mixed signal with a slight bullish bias.
- Volatility is low, indicating a lack of significant price fluctuations.
- Volume indicators suggest accumulation but with some signs of distribution.
Conclusion:
Based on the analysis of the technical indicators, the next few days' possible stock price movement for FNGD is likely to be sideways with a bearish bias. While momentum indicators show a slight bullish momentum, the overall trend and volume indicators suggest a bearish sentiment. The low volatility environment also supports a sideways movement. Traders should exercise caution and consider potential short-term downside risks in their trading strategies.