Technical Analysis of FTRB 2024-05-10
Overview:
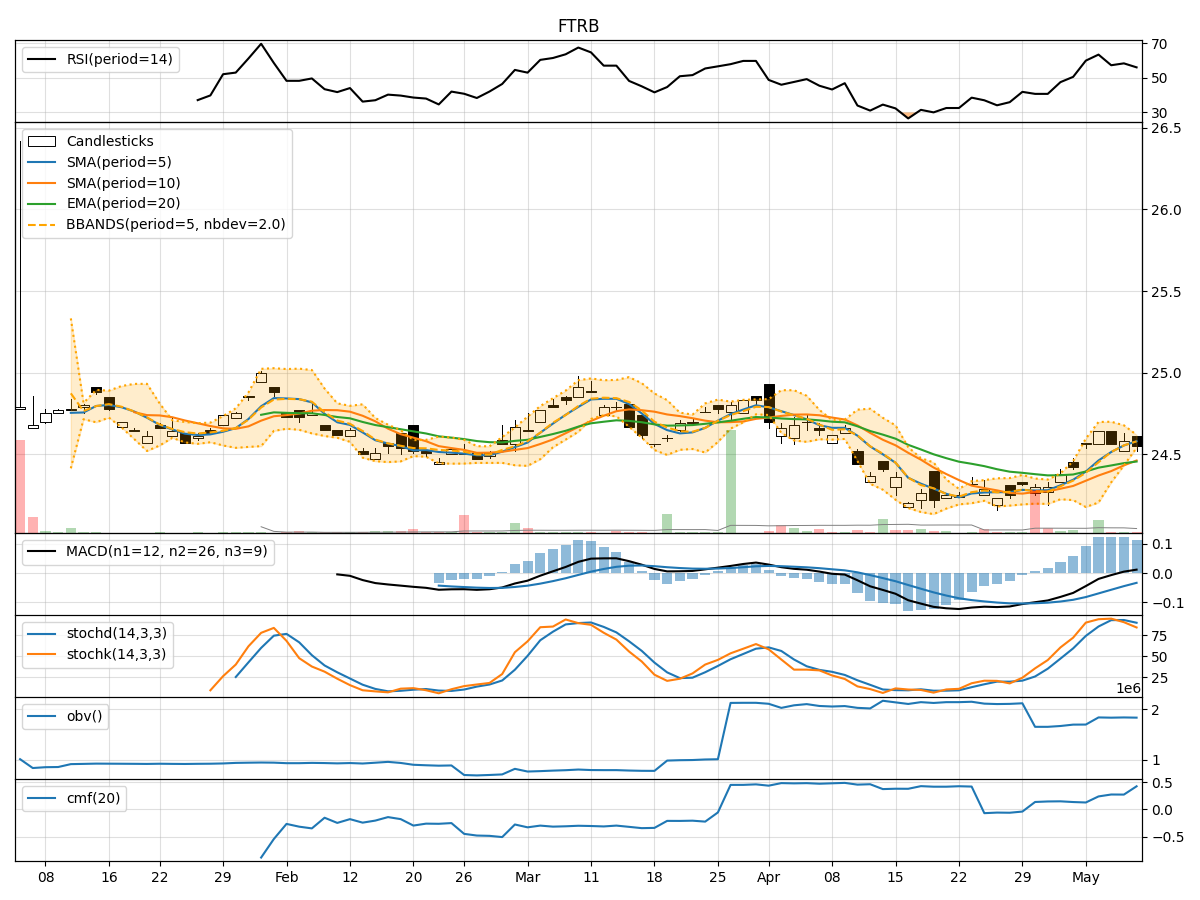
In analyzing the technical indicators for FTRB over the last 5 days, we will delve into the trend, momentum, volatility, and volume indicators to provide a comprehensive outlook on the possible stock price movement in the coming days.
Trend Indicators:
- Moving Averages (MA): The 5-day Moving Average (MA) has been consistently above the Simple Moving Average (SMA) and Exponential Moving Average (EMA), indicating a short-term bullish trend.
- MACD: The MACD line has been consistently above the signal line, with both lines showing an upward trend, suggesting bullish momentum.
- Conclusion: The trend indicators point towards an upward trend in the stock price.
Momentum Indicators:
- RSI: The Relative Strength Index (RSI) has been fluctuating around the 50 level, indicating a neutral momentum.
- Stochastic Oscillator: Both %K and %D have been declining, suggesting a weakening momentum.
- Conclusion: The momentum indicators signal a neutral to slightly bearish momentum in the stock.
Volatility Indicators:
- Bollinger Bands (BB): The stock price has been trading within the Bollinger Bands, with the bands narrowing, indicating decreasing volatility.
- Conclusion: Volatility is decreasing, suggesting a consolidation phase in the stock price.
Volume Indicators:
- On-Balance Volume (OBV): The OBV has been relatively stable, indicating consistent buying pressure.
- Chaikin Money Flow (CMF): The CMF has been positive, reflecting a healthy inflow of money into the stock.
- Conclusion: Volume indicators suggest positive buying pressure in the stock.
Overall Conclusion:
Based on the analysis of the technical indicators, the stock of FTRB is likely to experience a sideways movement in the coming days, with a potential for a slight upward bias due to the bullish trend indicators. However, the neutral to slightly bearish momentum and decreasing volatility may limit significant price movements. Investors may consider monitoring key support and resistance levels for potential entry or exit points.
Recommendation:
- Short-term Traders: Consider waiting for clearer signals or confirmation of a stronger trend before taking positions.
- Long-term Investors: Monitor the stock closely for any developments that could shift the current sideways movement towards a more definitive trend.
By combining insights from trend, momentum, volatility, and volume indicators, investors can make more informed decisions aligned with the current market dynamics.