Technical Analysis of FUMB 2024-05-10
Overview:
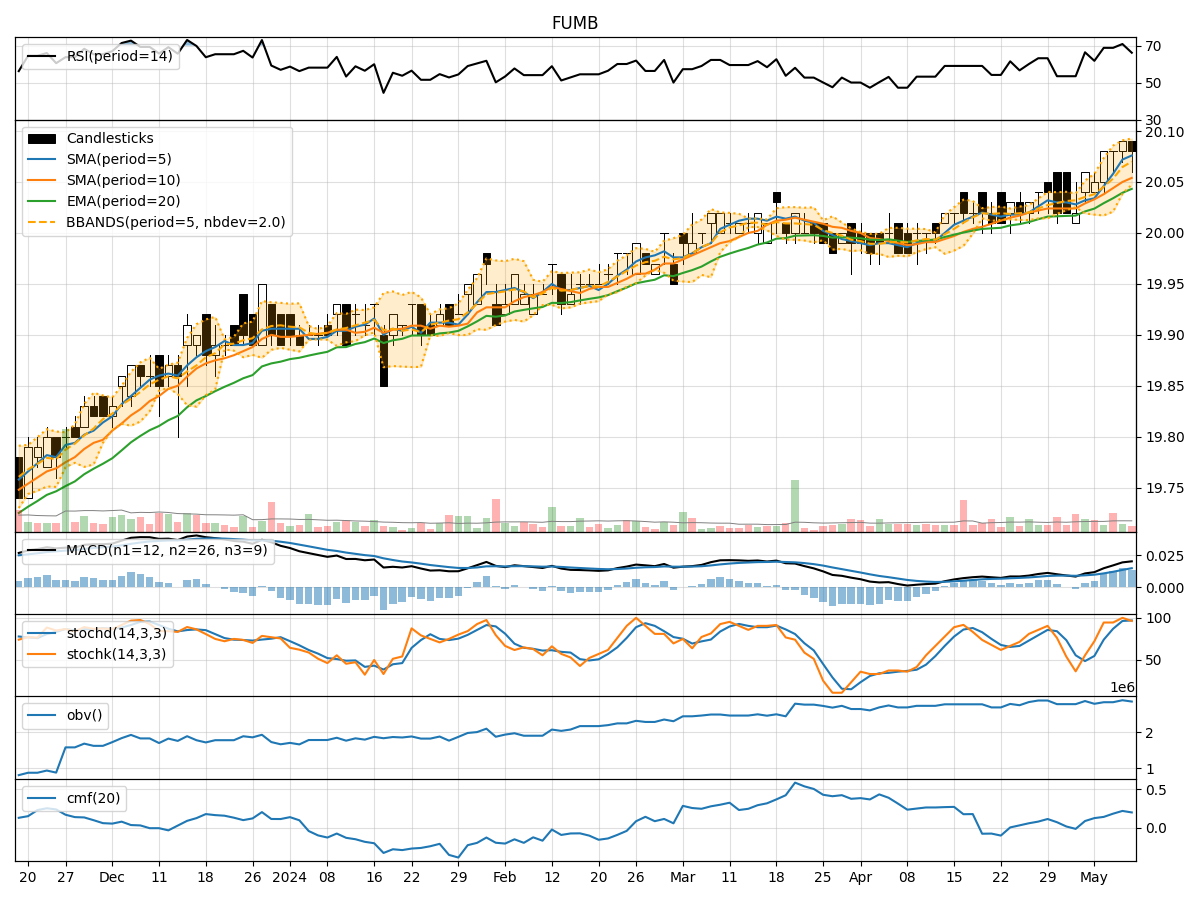
In analyzing the technical indicators for FUMB stock over the last 5 days, we will delve into the trend, momentum, volatility, and volume indicators to provide a comprehensive outlook on the possible stock price movement in the coming days. By examining these key indicators, we aim to offer valuable insights and predictions for potential investors.
Trend Indicators:
- Moving Averages (MA): The 5-day MA has been consistently above the closing prices, indicating a short-term uptrend.
- MACD: The MACD line has been positive and increasing, suggesting bullish momentum.
- EMA: The EMA has been trending upwards, supporting the bullish sentiment.
Key Observation: The trend indicators point towards a bullish outlook for FUMB stock.
Momentum Indicators:
- RSI: The RSI has been in the overbought territory, indicating strong buying momentum.
- Stochastic Oscillator: Both %K and %D have been in the overbought zone, signaling potential overvaluation.
- Williams %R: The indicator has been in the oversold region, suggesting a possible reversal.
Key Observation: Momentum indicators show a mixed signal with overbought conditions, hinting at a potential pullback.
Volatility Indicators:
- Bollinger Bands (BB): The stock price has been trading within the bands, indicating normal volatility.
- Bollinger %B: The %B has been fluctuating around the midline, reflecting a balanced market sentiment.
Key Observation: Volatility indicators suggest a sideways movement with no clear trend.
Volume Indicators:
- On-Balance Volume (OBV): The OBV has been increasing, signaling accumulation by investors.
- Chaikin Money Flow (CMF): The CMF has been positive, indicating buying pressure.
Key Observation: Volume indicators support the bullish sentiment with increasing accumulation.
Conclusion:
Based on the analysis of the technical indicators, the overall outlook for FUMB stock in the next few days is bullish with a potential for a short-term pullback due to overbought conditions in momentum indicators. The trend indicators suggest a continued uptrend, supported by increasing volumes and positive EMA and MACD. However, the sideways movement indicated by volatility indicators may lead to some consolidation before a potential upward move.
Key Conclusion: The stock is likely to experience upward movement in the coming days, but investors should be cautious of a possible short-term correction due to overbought momentum signals.