Technical Analysis of FXU 2024-05-10
Overview:
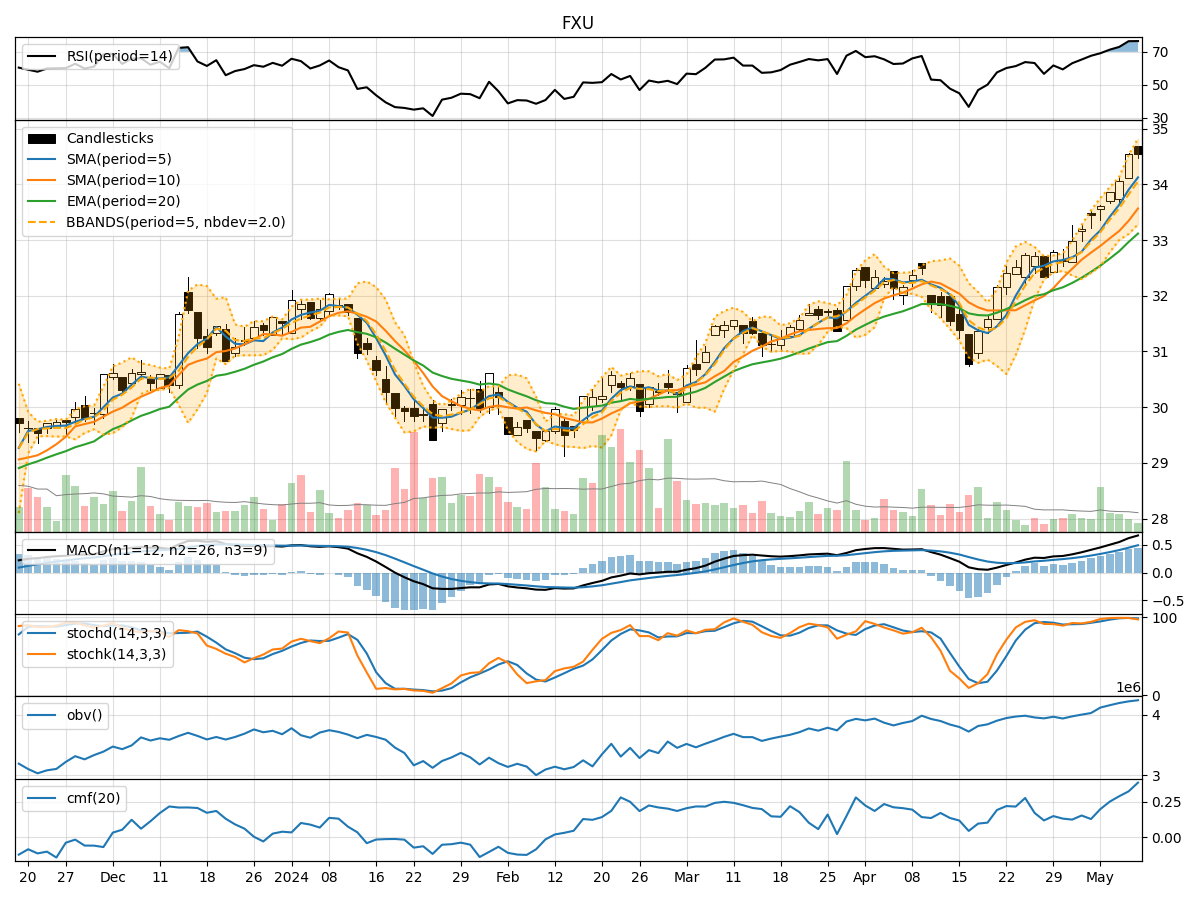
In analyzing the technical indicators for FXU over the last 5 days, we will delve into the trend, momentum, volatility, and volume indicators to provide a comprehensive outlook on the possible stock price movement in the coming days.
Trend Indicators:
- Moving Averages (MA): The 5-day MA has been consistently above the closing prices, indicating an upward trend. Both the SMA(10) and EMA(20) have also been trending upwards, supporting the bullish sentiment.
- MACD: The MACD line has been above the signal line for the past 5 days, with both lines showing an upward trajectory. The MACD histogram has been increasing, indicating strengthening bullish momentum.
Momentum Indicators:
- RSI: The RSI has been in the overbought territory for the last few days, suggesting a strong bullish momentum in the stock.
- Stochastic Oscillator: Both %K and %D lines have been in the overbought zone, indicating a strong buying pressure.
- Williams %R: The Williams %R has been consistently in the oversold region, signaling a potential reversal in the stock price.
Volatility Indicators:
- Bollinger Bands: The stock price has been consistently trading above the middle Bollinger Band, indicating an upward price movement. The bands are widening, suggesting increasing volatility.
- Bollinger %B: The %B indicator has been above 0.5, indicating that the stock is trading above the middle band and is in an uptrend.
Volume Indicators:
- On-Balance Volume (OBV): The OBV has been steadily increasing over the last 5 days, indicating strong buying volume in the stock.
- Chaikin Money Flow (CMF): The CMF has been positive and rising, indicating strong buying pressure in the stock.
Conclusion:
Based on the analysis of the technical indicators, the overall outlook for FXU is bullish in the coming days. The trend indicators, momentum indicators, volatility indicators, and volume indicators all point towards a continuation of the current upward trend. The stock is likely to experience further price appreciation, driven by strong buying pressure and bullish momentum.
Key Points:
- Trend: Upward trend supported by moving averages and MACD.
- Momentum: Strong bullish momentum indicated by RSI and Stochastic Oscillator.
- Volatility: Increasing volatility with the price trading above the middle Bollinger Band.
- Volume: Strong buying volume and positive CMF signal sustained bullish sentiment.
Recommendation:
Considering the bullish signals across all technical indicators, it is advisable to consider buying or holding FXU in the coming days. Traders and investors can capitalize on the anticipated price appreciation by maintaining a bullish stance on the stock.