Technical Analysis of GBIL 2024-05-10
Overview:
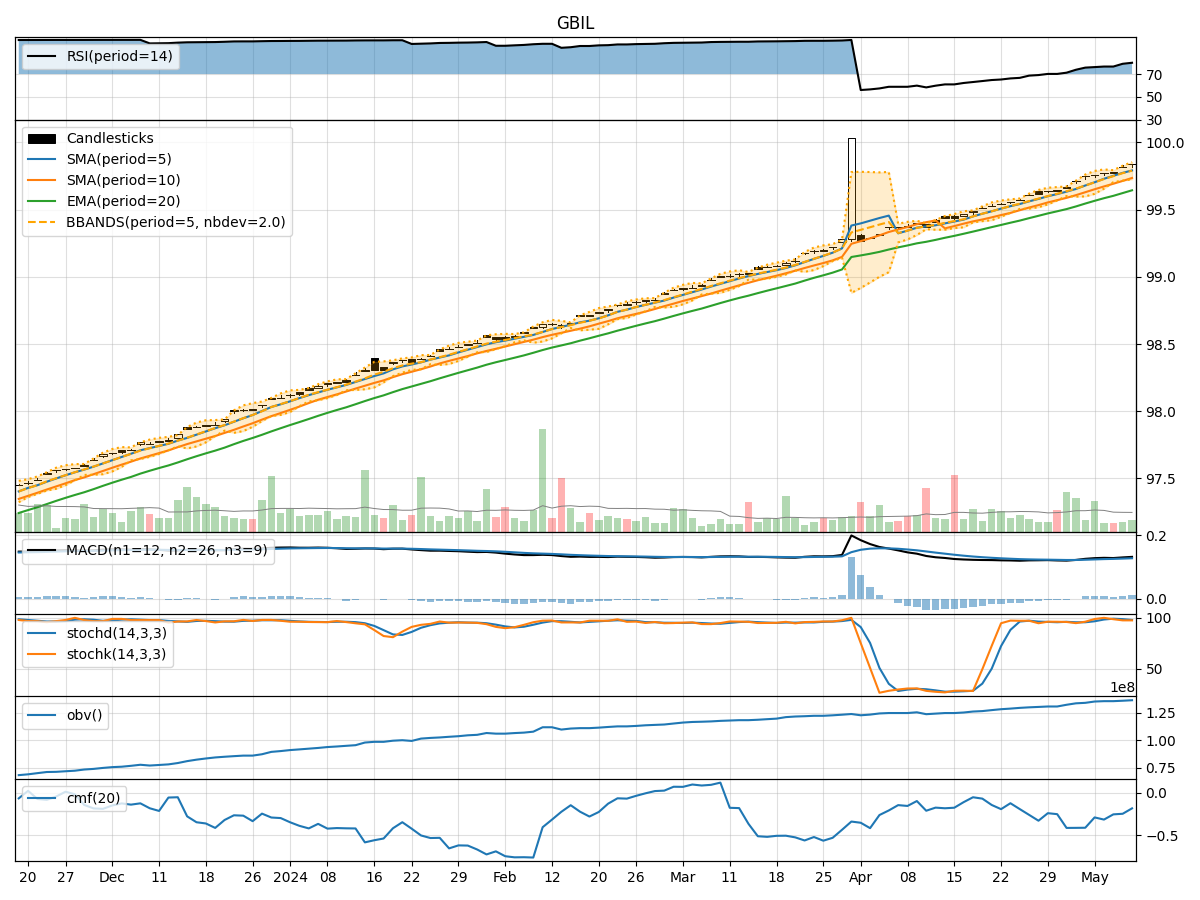
In analyzing the technical indicators for GBIL over the last 5 days, we will delve into the trend, momentum, volatility, and volume indicators to provide a comprehensive outlook on the possible stock price movement in the coming days. By examining these key aspects, we aim to offer valuable insights and recommendations for potential investors.
Trend Indicators:
- Moving Averages (MA): The 5-day MA has been consistently above the closing prices, indicating a short-term uptrend.
- MACD: The MACD line has been positive and increasing, suggesting bullish momentum.
- EMA: The EMA has been trending upwards, reflecting a positive sentiment in the market.
Key Observation: The trend indicators point towards a bullish outlook for GBIL.
Momentum Indicators:
- RSI: The RSI has been in the overbought territory, indicating strong buying momentum.
- Stochastic Oscillator: Both %K and %D have been relatively high, signaling potential overbought conditions.
- Williams %R: The indicator has shown mixed signals, hovering around the oversold region.
Key Observation: Momentum indicators suggest a cautious stance due to potential overbought conditions.
Volatility Indicators:
- Bollinger Bands: The price has been trading within the bands, indicating normal volatility.
- Bollinger %B: The %B indicator has been fluctuating within a normal range, reflecting typical price movements.
Key Observation: Volatility indicators suggest a stable market environment.
Volume Indicators:
- On-Balance Volume (OBV): The OBV has shown a slight increase, indicating some accumulation.
- Chaikin Money Flow (CMF): The CMF has been negative, suggesting outflows in the market.
Key Observation: Volume indicators imply a neutral to slightly bearish sentiment.
Conclusion:
Based on the analysis of trend, momentum, volatility, and volume indicators, the overall outlook for GBIL in the next few days appears to be upward. The bullish trend indicated by moving averages and MACD, coupled with strong buying momentum from the RSI, supports a positive price movement. However, caution is advised due to potential overbought conditions highlighted by the stochastic oscillator. Volatility remains stable, indicating a predictable market environment. While volume indicators show a neutral to slightly bearish sentiment, the overall technical analysis suggests a potential upward trajectory for GBIL in the coming days. Investors should closely monitor key resistance levels and consider risk management strategies to capitalize on potential gains while mitigating risks.