Technical Analysis of GGLL 2024-05-10
Overview:
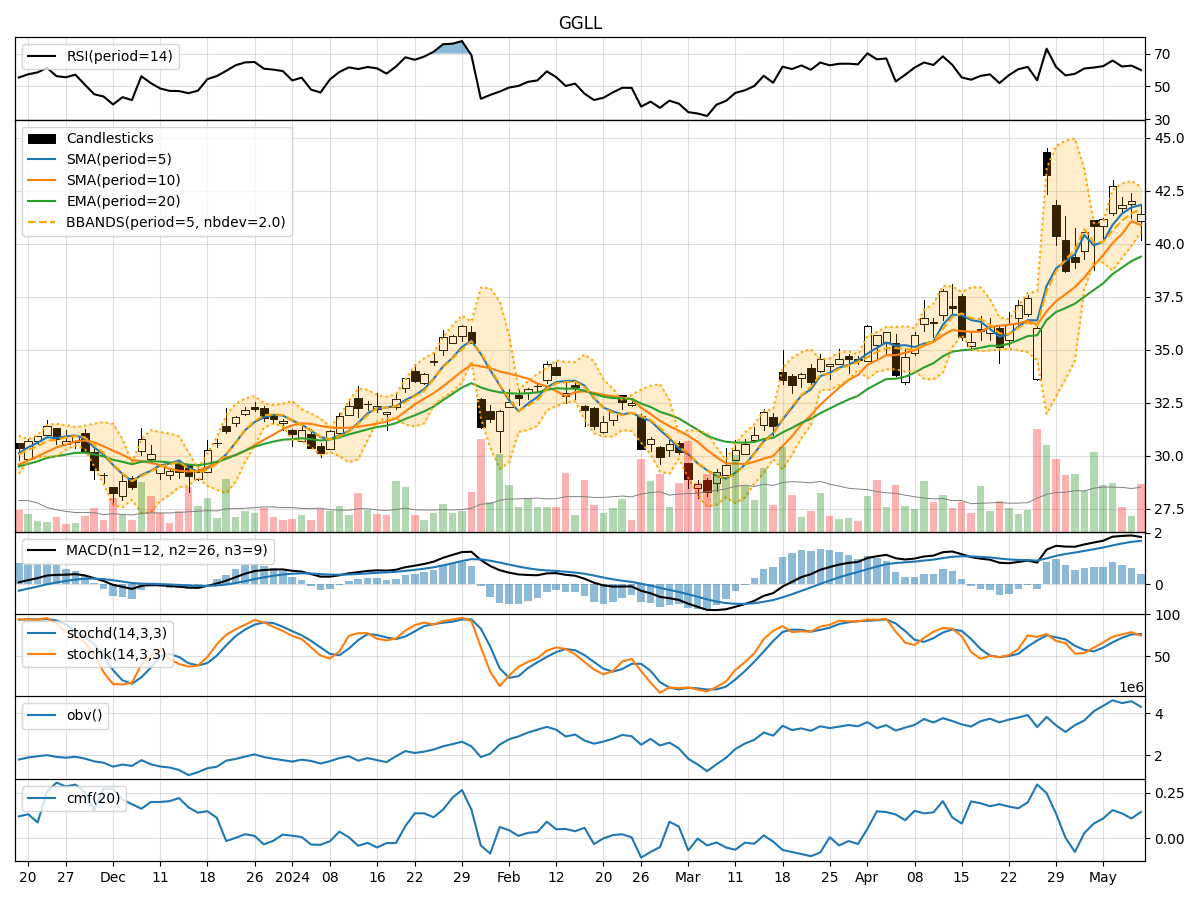
In analyzing the technical indicators for GGLL over the last 5 days, we will delve into the trend, momentum, volatility, and volume indicators to provide a comprehensive outlook on the possible stock price movement in the coming days. By examining these key aspects, we aim to offer valuable insights and predictions for informed decision-making.
Trend Analysis:
- Moving Averages (MA): The 5-day Moving Average (MA) has been consistently above the Simple Moving Average (SMA) and Exponential Moving Average (EMA), indicating a bullish trend.
- MACD: The MACD line has been above the signal line, with both lines showing an upward trend, suggesting positive momentum.
Momentum Analysis:
- RSI: The Relative Strength Index (RSI) has been fluctuating around the 60-70 range, indicating a neutral momentum.
- Stochastic Oscillator: Both %K and %D have been in the overbought zone, suggesting a potential reversal or consolidation.
Volatility Analysis:
- Bollinger Bands (BB): The stock price has mostly stayed within the Bollinger Bands, with the bands narrowing, indicating decreasing volatility.
Volume Analysis:
- On-Balance Volume (OBV): The OBV has shown mixed movements, reflecting indecision among investors.
- Chaikin Money Flow (CMF): The CMF has been positive but relatively stable, signaling moderate buying pressure.
Key Observations:
- The trend indicators suggest a bullish sentiment, supported by the moving averages and MACD.
- Momentum indicators show a neutral stance, with the RSI hovering in a range and stochastic oscillators in the overbought zone.
- Volatility has been decreasing, as indicated by the narrowing Bollinger Bands.
- Volume indicators reflect mixed signals, with OBV showing no clear direction and CMF indicating moderate buying pressure.
Conclusion:
Based on the analysis of the technical indicators, the stock price of GGLL is likely to experience sideways consolidation in the coming days. The bullish trend indicated by moving averages and MACD may face resistance due to the neutral momentum and overbought stochastic oscillators. The decreasing volatility suggests a potential period of stability, while the mixed volume signals imply a lack of strong conviction from market participants. Therefore, it is advisable to exercise caution and closely monitor price movements for potential shifts in market sentiment.