Technical Analysis of GJAN 2024-05-31
Overview:
In analyzing the technical indicators for GJAN over the last 5 days, we will delve into the trend, momentum, volatility, and volume indicators to provide a comprehensive outlook on the possible stock price movement in the coming days. By examining these key aspects, we aim to offer valuable insights and recommendations for potential investors.
Trend Analysis:
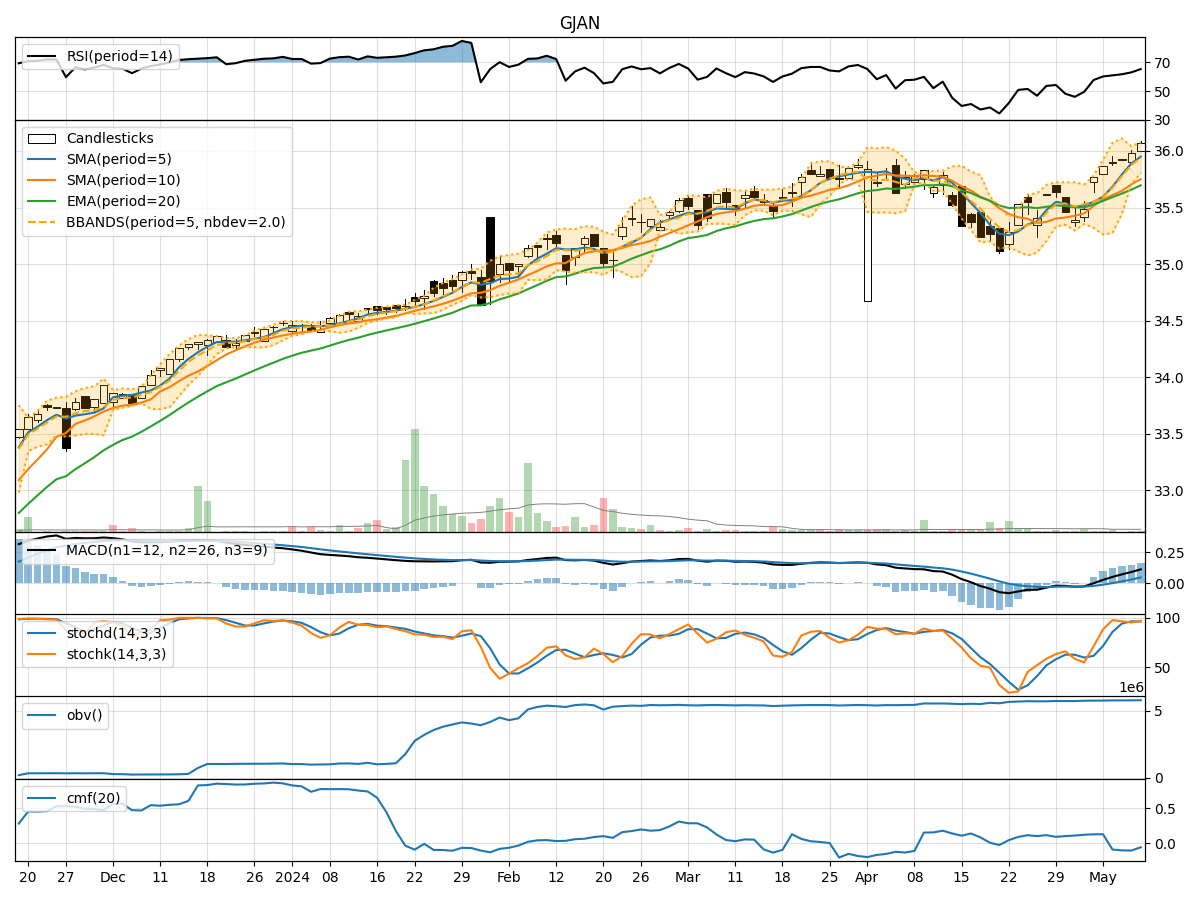
- Moving Averages (MA): The 5-day Moving Average (MA) has been relatively stable around the closing prices, indicating a consistent trend.
- MACD and Signal Line: The MACD line has shown slight fluctuations around the signal line, suggesting a neutral momentum in the short term.
- Relative Strength Index (RSI): The RSI values have fluctuated but remained within the neutral range, indicating a balanced buying and selling pressure.
Momentum Analysis:
- Stochastic Oscillator: The Stochastic Oscillator has shown a downward trend, indicating a potential bearish momentum.
- Williams %R (WillR): The Williams %R values have been fluctuating but are currently in the oversold territory, suggesting a possible reversal.
Volatility Analysis:
- Bollinger Bands (BB): The Bollinger Bands have shown narrowing bands, indicating decreasing volatility and a potential consolidation phase.
- Bollinger Band %B (BBP): The %B values have been fluctuating but are currently closer to the lower band, suggesting a possible oversold condition.
Volume Analysis:
- On-Balance Volume (OBV): The OBV values have shown a slight decrease, indicating a potential distribution phase.
- Chaikin Money Flow (CMF): The CMF values have been negative, suggesting a bearish money flow in the market.
Conclusion:
Based on the analysis of the technical indicators, the stock of GJAN is likely to experience further downward movement in the coming days. The bearish momentum indicated by the Stochastic Oscillator, oversold condition highlighted by Williams %R, and negative CMF values all point towards a potential continuation of the current downtrend. Additionally, the narrowing Bollinger Bands and decreasing OBV values further support the likelihood of a downward price movement.
Investors should exercise caution and consider waiting for more definitive signals of a trend reversal before considering any long positions. The overall outlook for GJAN is bearish in the short term.