Technical Analysis of GLDM 2024-05-10
Overview:
In analyzing the technical indicators for GLDM over the last 5 days, we will delve into the trend, momentum, volatility, and volume indicators to provide a comprehensive outlook on the possible stock price movement in the coming days. By examining these key aspects, we aim to offer valuable insights and recommendations for your investment decisions.
Trend Analysis:
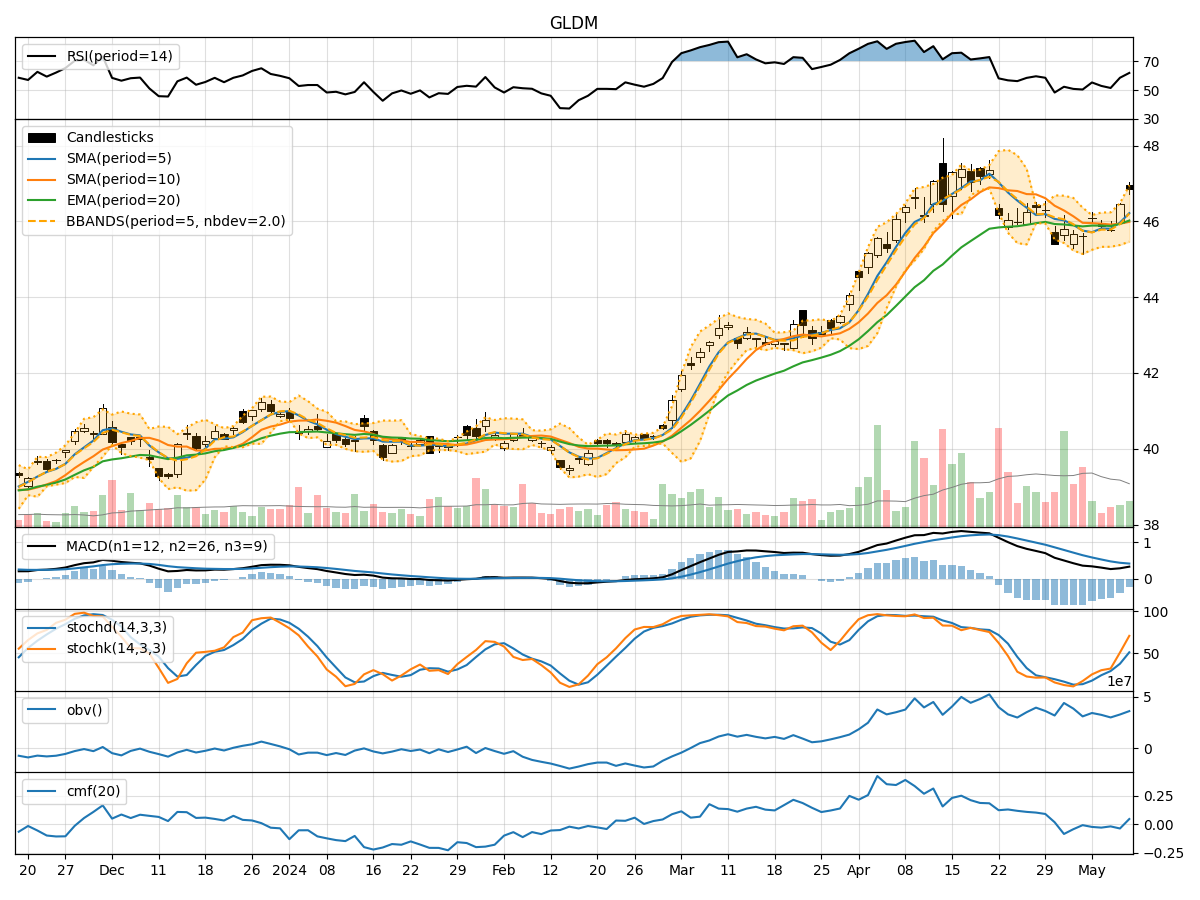
- Moving Averages (MA): The 5-day MA has been consistently above the closing prices, indicating a short-term uptrend.
- MACD: The MACD line has been positive, suggesting bullish momentum.
- RSI: The RSI has been fluctuating around the neutral zone, indicating indecision in the market sentiment.
Key Observation: The trend indicators suggest a mildly bullish sentiment in the short term.
Momentum Analysis:
- Stochastic Oscillator: Both %K and %D have been rising, indicating increasing buying pressure.
- Williams %R: The indicator has been hovering in the oversold territory, signaling a potential reversal.
Key Observation: Momentum indicators point towards a potential bullish reversal in the near future.
Volatility Analysis:
- Bollinger Bands (BB): The bands have been widening, indicating increased volatility.
- Average True Range (ATR): ATR has shown an uptrend, reflecting rising price volatility.
Key Observation: Volatility indicators suggest a heightened level of price fluctuations in the stock.
Volume Analysis:
- On-Balance Volume (OBV): The OBV has been fluctuating, indicating mixed buying and selling pressure.
- Chaikin Money Flow (CMF): The CMF has been negative, suggesting outflow of money from the stock.
Key Observation: Volume indicators reflect a lack of strong conviction from market participants.
Conclusion:
Based on the analysis of the technical indicators, the next few days' possible stock price movement for GLDM is likely to be upward with a bullish bias. The trend indicators support a continuation of the short-term uptrend, while momentum indicators signal a potential bullish reversal. Although volatility is high, it could provide trading opportunities for investors. However, the mixed signals from volume indicators indicate caution and the need for further confirmation.
Overall Recommendation: Considering the overall technical outlook, it is advisable to consider long positions in GLDM with proper risk management strategies in place. Keep a close watch on key support and resistance levels to make informed trading decisions.