Technical Analysis of GSIG 2024-05-10
Overview:
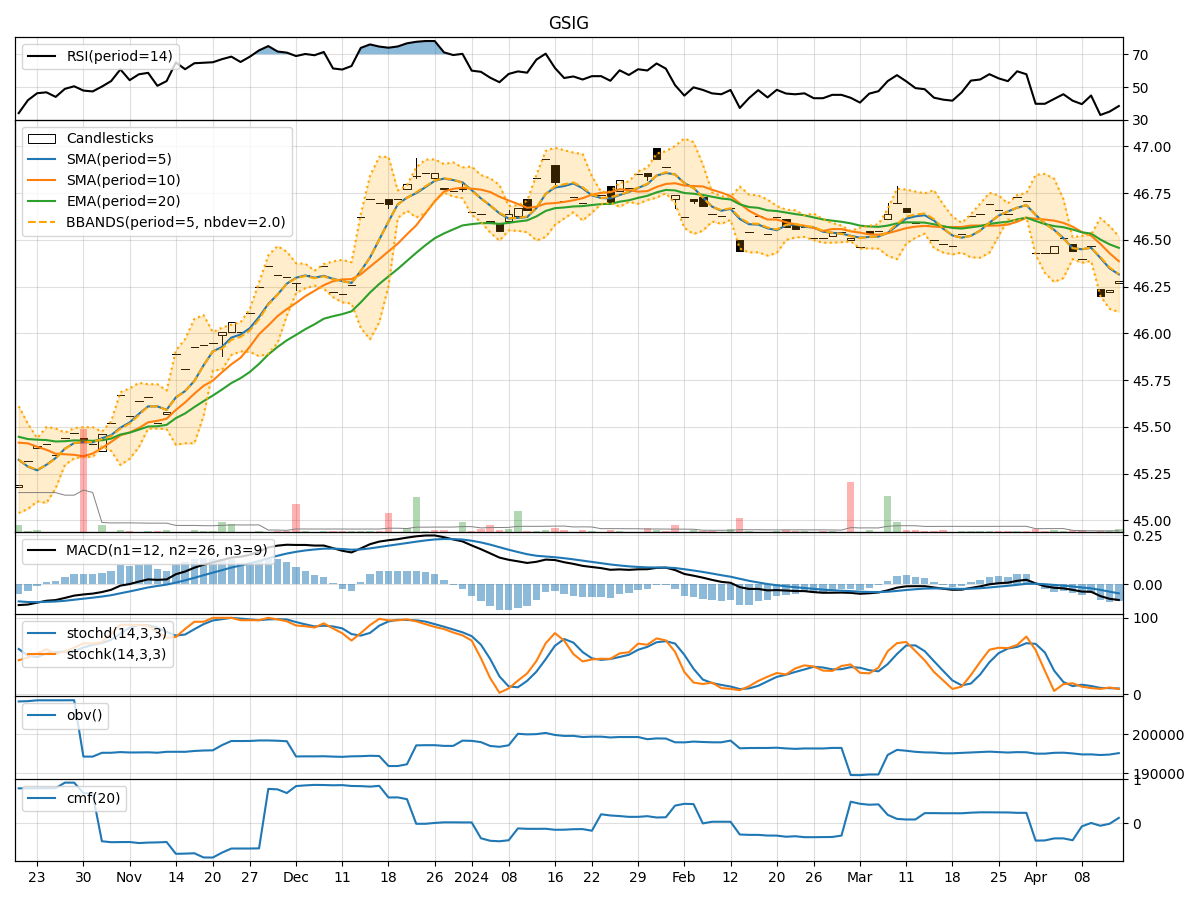
In analyzing the technical indicators for GSIG over the last 5 days, we will delve into the trend, momentum, volatility, and volume indicators to provide a comprehensive outlook on the possible stock price movement. By examining these key aspects, we aim to offer valuable insights and predictions for the upcoming days.
Trend Indicators:
- Moving Averages (MA): The 5-day MA has been consistently above the closing prices, indicating a short-term uptrend.
- MACD: The MACD line has been above the signal line, suggesting bullish momentum.
- RSI: The RSI has been in the overbought territory, reflecting strong buying pressure.
Key Observation: The trend indicators point towards a bullish sentiment in the short term.
Momentum Indicators:
- Stochastic Oscillator: Both %K and %D have been in the overbought zone, signaling a potential reversal.
- Williams %R: The indicator has been in the oversold region, hinting at a possible buying opportunity.
Key Observation: Momentum indicators suggest a mixed outlook with potential for a short-term correction.
Volatility Indicators:
- Bollinger Bands (BB): The price has mostly stayed within the bands, indicating stable volatility.
- BB %B: The %B has fluctuated around the midline, reflecting balanced price action.
Key Observation: Volatility indicators imply a sideways movement with no significant price swings expected.
Volume Indicators:
- On-Balance Volume (OBV): The OBV has shown a slight increase, suggesting accumulation.
- Chaikin Money Flow (CMF): The CMF has been positive, indicating buying pressure.
Key Observation: Volume indicators support a bullish bias with increasing buying interest.
Conclusion:
Based on the analysis of trend, momentum, volatility, and volume indicators, the overall outlook for GSIG in the next few days appears to be bullish with a potential for a short-term correction. The trend indicators signal a continued uptrend, supported by strong buying pressure as indicated by the RSI. However, the momentum indicators suggest a possible reversal in the short term, highlighting the need for caution.
Considering the stable volatility and positive volume indicators, there is a high probability of upward movement in the stock price. Traders should monitor the stochastic oscillator for a potential reversal signal and adjust their positions accordingly. Overall, the stock is likely to experience further upside in the coming days, but with a possibility of short-term corrections.
Key Takeaway:
- Bullish Bias: Trend and volume indicators support a bullish view.
- Short-Term Correction: Momentum indicators hint at a potential reversal.
- Monitor Stochastic Oscillator: Look for signals of a short-term pullback.
In conclusion, investors should consider the bullish trend but remain vigilant for any signs of a short-term correction. It is essential to combine technical analysis with risk management strategies to make informed trading decisions.