Technical Analysis of GSST 2024-05-10
Overview:
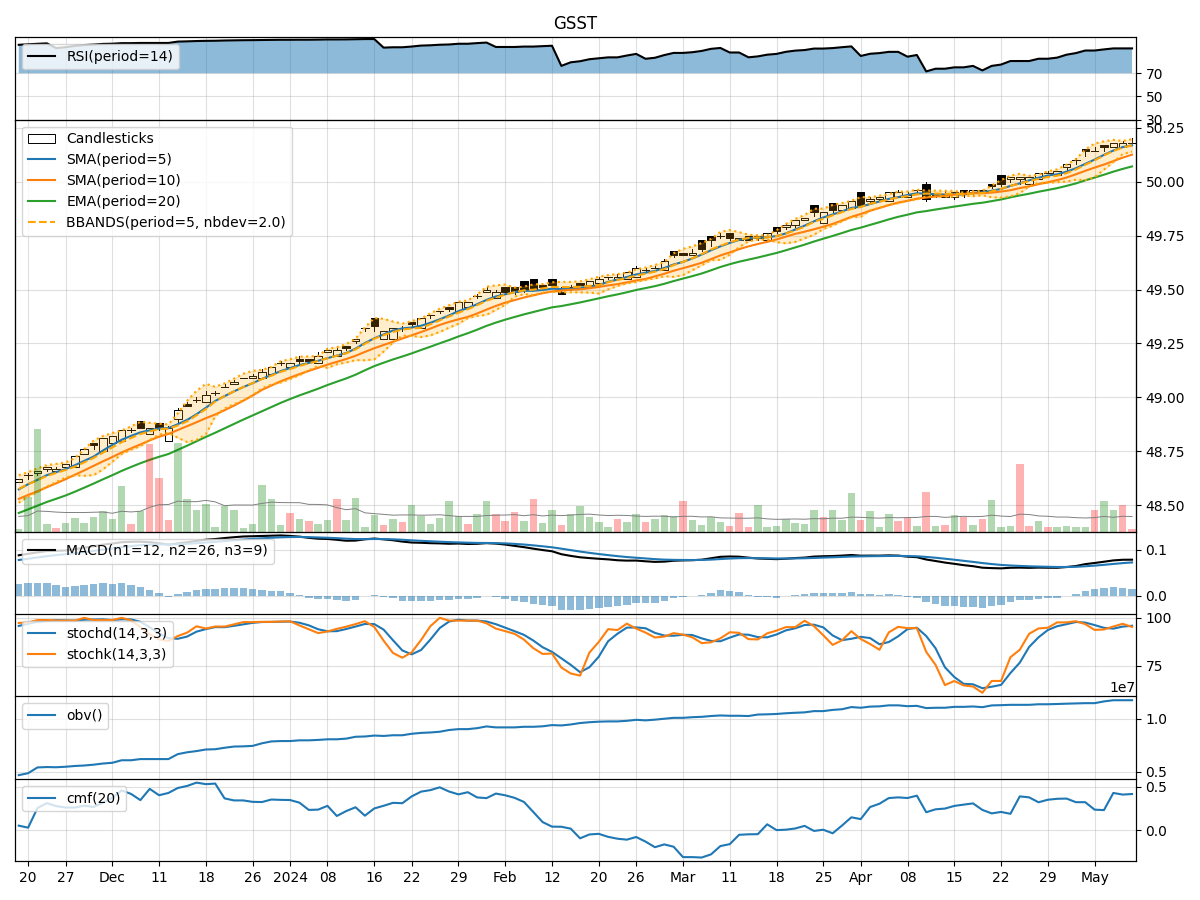
In analyzing the technical indicators for GSST over the last 5 days, we will delve into the trend, momentum, volatility, and volume indicators to provide a comprehensive outlook on the possible stock price movement in the coming days.
Trend Analysis:
- Moving Averages (MA): The 5-day Moving Average (MA) has been consistently above the Simple Moving Average (SMA) and Exponential Moving Average (EMA), indicating a bullish trend.
- MACD: The MACD line has been consistently above the signal line, suggesting a bullish momentum in the stock price.
Momentum Analysis:
- RSI: The Relative Strength Index (RSI) has been consistently high, indicating overbought conditions.
- Stochastic Oscillator: Both %K and %D have been in the overbought zone, signaling a potential reversal.
Volatility Analysis:
- Bollinger Bands (BB): The stock price has been trading within the upper Bollinger Band, indicating high volatility.
Volume Analysis:
- On-Balance Volume (OBV): The OBV has been relatively stable, suggesting consistent buying pressure.
- Chaikin Money Flow (CMF): The CMF has shown an increasing trend, indicating strong buying pressure.
Key Observations:
- The stock is in a strong bullish trend based on moving averages and MACD.
- Momentum indicators suggest overbought conditions, potentially leading to a reversal.
- Volatility is high, as indicated by the upper Bollinger Band.
- Volume indicators show consistent buying pressure.
Conclusion:
Based on the analysis of technical indicators, the stock is likely to experience a short-term correction or consolidation due to overbought conditions indicated by momentum indicators. However, the overall trend remains bullish, supported by moving averages and volume indicators. Traders may consider taking profits or waiting for a pullback before entering new positions. Exercise caution in the short term due to the potential for a reversal in momentum.