Technical Analysis of HDV 2024-05-10
Overview:
In analyzing the technical indicators for HDV over the last 5 days, we will delve into the trend, momentum, volatility, and volume indicators to provide a comprehensive outlook on the possible stock price movement in the coming days.
Trend Analysis:
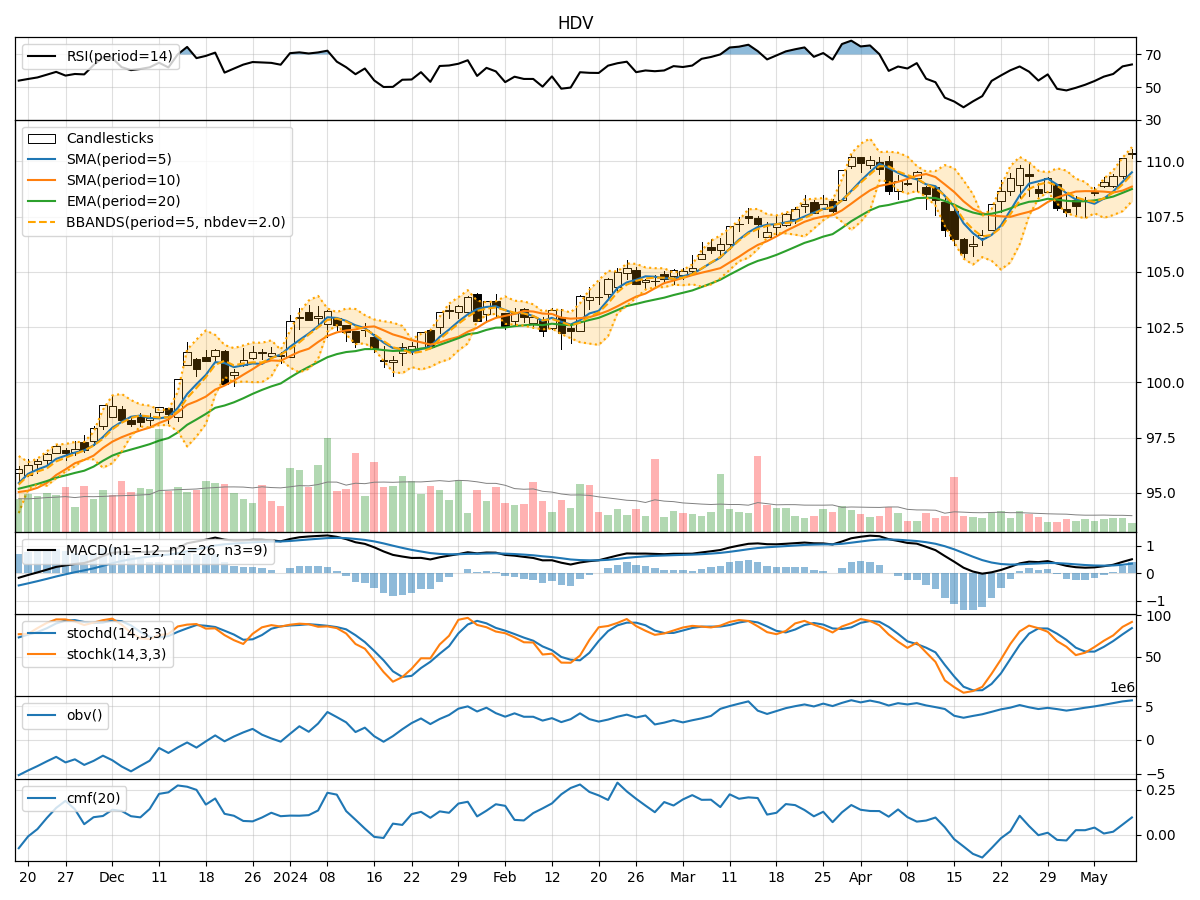
- Moving Averages (MA): The 5-day Moving Average (MA) has been consistently above the 10-day Simple Moving Average (SMA), indicating a short-term bullish trend.
- Exponential Moving Average (EMA): The EMA has been showing an upward trend, suggesting positive momentum in the stock price.
- Moving Average Convergence Divergence (MACD): The MACD and Signal Line have been trending upwards, with the MACD line consistently above the Signal Line, signaling a bullish momentum.
Momentum Analysis:
- Relative Strength Index (RSI): The RSI has been increasing and is currently in the overbought territory, indicating a potential reversal or consolidation.
- Stochastic Oscillator: Both %K and %D have been rising and are in the overbought zone, suggesting a possible pullback in the stock price.
- Williams %R (Willams %R): The Williams %R is in the oversold region, indicating a potential reversal to the upside.
Volatility Analysis:
- Bollinger Bands (BB): The stock price has been trading within the upper Bollinger Band, indicating an overbought condition. However, the bands are widening, suggesting increased volatility.
- Bollinger Band %B (BB %B): The %B is currently below 1, indicating a potential buying opportunity as the stock price might revert to the mean.
Volume Analysis:
- On-Balance Volume (OBV): The OBV has been steadily increasing, indicating strong buying pressure in the stock.
- Chaikin Money Flow (CMF): The CMF has been positive, suggesting that money is flowing into the stock.
Conclusion:
Based on the analysis of the technical indicators, the stock price of HDV is likely to experience a short-term pullback or consolidation in the coming days. The overbought conditions in the RSI and Stochastic Oscillator, coupled with the stock trading at the upper Bollinger Band, indicate a potential reversal or sideways movement. Traders may consider taking profits or waiting for a better entry point before considering long positions.