Technical Analysis of HIDV 2024-05-10
Overview:
In analyzing the technical indicators for HIDV over the last 5 days, we will delve into the trend, momentum, volatility, and volume indicators to provide a comprehensive outlook on the possible stock price movement. By examining these key factors, we aim to offer valuable insights and predictions for the upcoming trading days.
Trend Indicators:
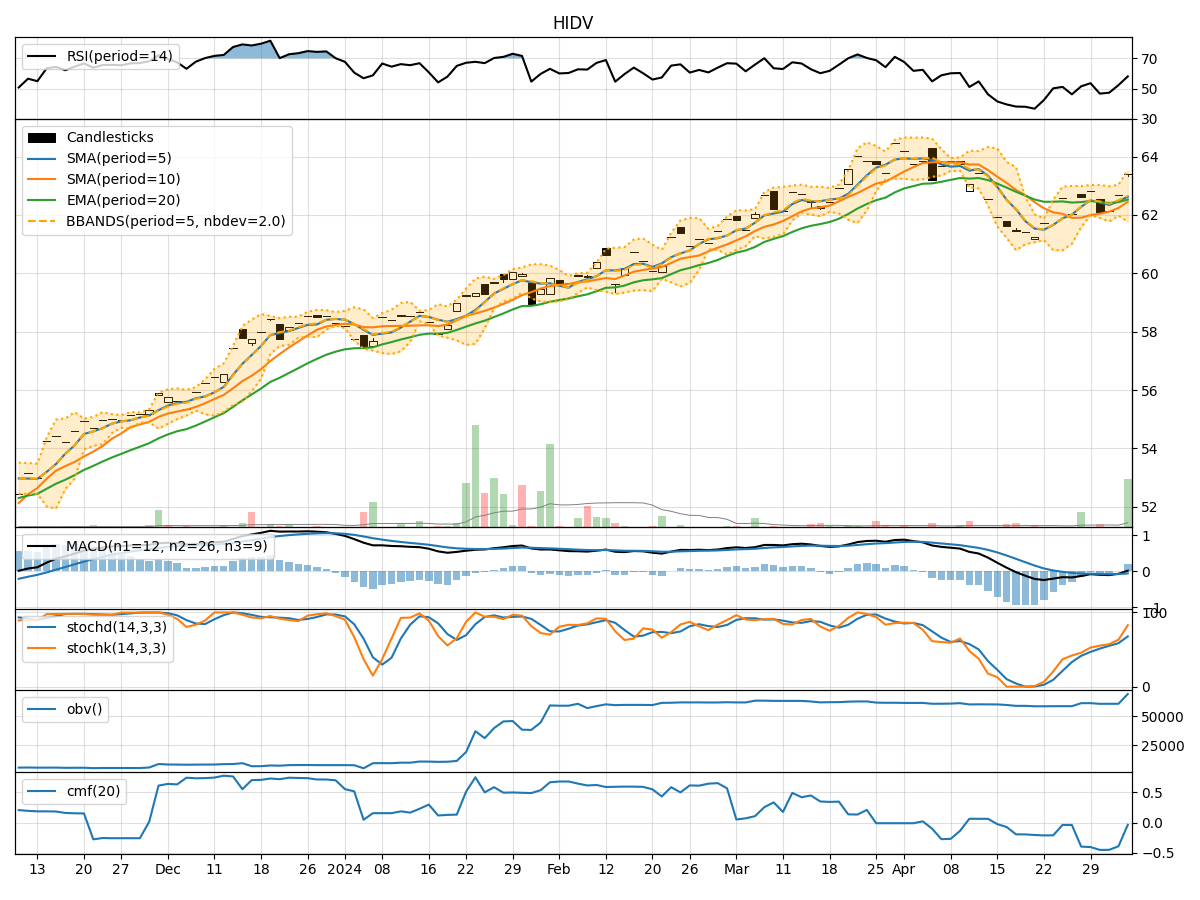
- Moving Averages (MA): The 5-day MA has been consistently above the 10-day SMA and 20-day EMA, indicating a bullish trend in the short term.
- MACD: The MACD line has been trending upwards, crossing above the signal line, suggesting a strengthening bullish momentum.
- RSI: The RSI has been increasing and is currently in the overbought territory, signaling a strong bullish sentiment.
Momentum Indicators:
- Stochastic Oscillator: Both %K and %D have been at 100%, indicating strong bullish momentum.
- Williams %R: The indicator has consistently been at 0, reflecting an extremely overbought condition.
Volatility Indicators:
- Bollinger Bands (BB): The bands have been narrowing, indicating decreasing volatility and a potential upcoming price breakout.
- BB %B: The %B indicator has been increasing, suggesting a potential bullish momentum.
Volume Indicators:
- On-Balance Volume (OBV): The OBV has been steadily increasing, indicating accumulation by investors.
- Chaikin Money Flow (CMF): The CMF has been negative, suggesting some selling pressure in the market.
Key Observations:
- The trend indicators, momentum indicators, and volatility indicators all point towards a strong bullish sentiment in the market.
- The volume indicators, particularly the OBV, support the bullish trend by showing accumulation of the stock.
- The overbought conditions in the RSI, Stochastic Oscillator, and Williams %R indicate a potential pullback or consolidation in the short term.
Conclusion:
Based on the analysis of the technical indicators, the next few days are likely to see a continuation of the bullish trend in HIDV. However, given the overbought conditions in some momentum indicators, a short-term pullback or consolidation may occur before the uptrend resumes. Traders should monitor the price action closely for potential entry or exit points, considering the possibility of a temporary reversal in the stock price.