Technical Analysis of HTAB 2024-05-10
Overview:
In analyzing the technical indicators for HTAB stock over the last 5 days, we will delve into the trend, momentum, volatility, and volume indicators to provide a comprehensive outlook on the possible stock price movement in the coming days. By examining these key aspects, we aim to offer valuable insights and predictions for potential investors.
Trend Analysis:
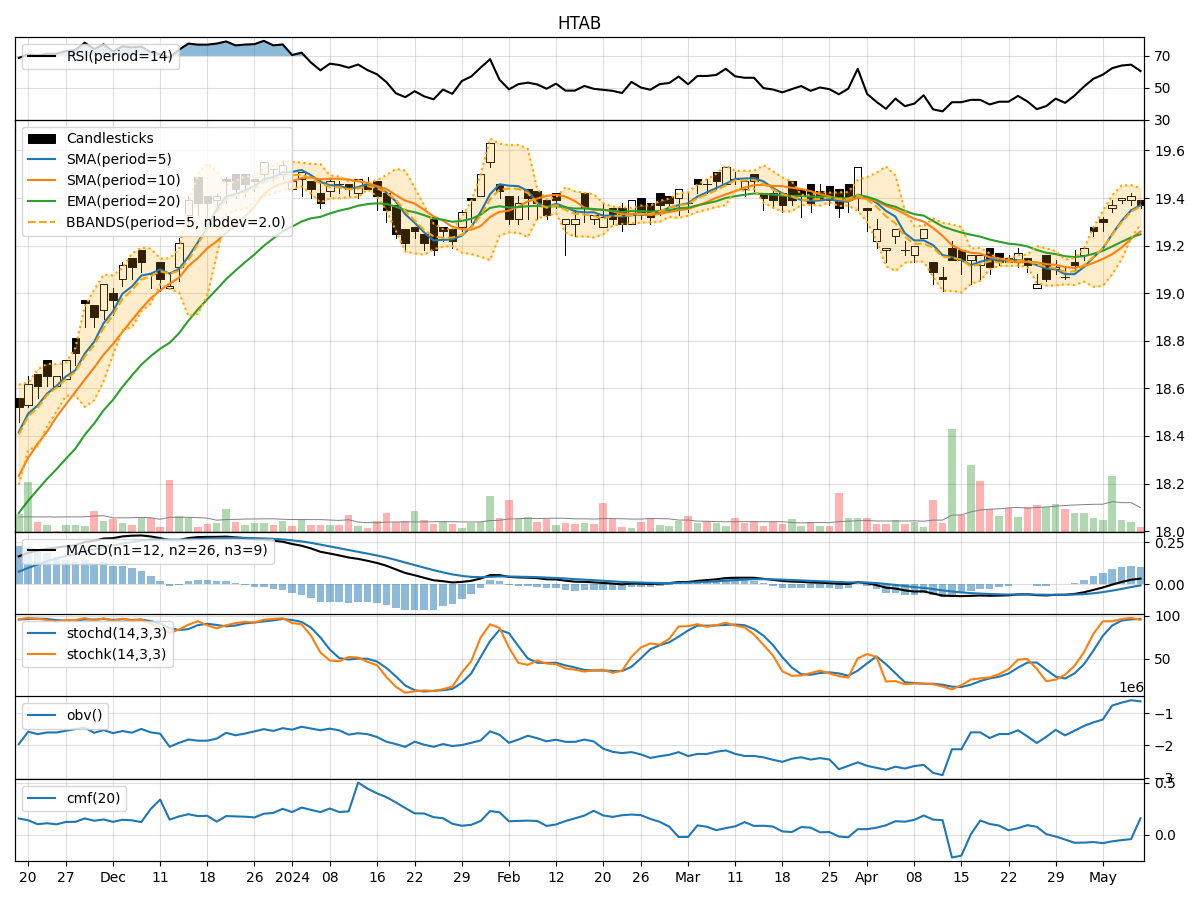
- Moving Averages (MA): The 5-day Moving Average (MA) has been consistently above the Simple Moving Average (SMA) and Exponential Moving Average (EMA), indicating a bullish trend.
- MACD: The MACD line has been consistently above the signal line, suggesting a positive momentum in the stock price.
- MACD Histogram: The MACD Histogram has been increasing, indicating strengthening bullish momentum.
Momentum Analysis:
- RSI: The Relative Strength Index (RSI) has been in the neutral zone, indicating neither overbought nor oversold conditions.
- Stochastic Oscillator: Both %K and %D have been in the overbought territory, suggesting a potential reversal or consolidation.
- Williams %R: The Williams %R is in the oversold region, signaling a possible buying opportunity.
Volatility Analysis:
- Bollinger Bands: The stock price has been trading within the Bollinger Bands, with the bands narrowing, indicating reduced volatility.
- Bollinger %B: The %B indicator is around 0.5, suggesting the stock is trading at the middle of the bands.
Volume Analysis:
- On-Balance Volume (OBV): The OBV has been fluctuating, indicating indecision among investors.
- Chaikin Money Flow (CMF): The CMF has been negative, suggesting outflow of money from the stock.
Conclusion:
Based on the analysis of the technical indicators, the next few days' possible stock price movement for HTAB is likely to be sideways with a slight bullish bias. The trend indicators show a bullish sentiment, supported by the MACD and moving averages. However, the momentum indicators suggest a potential reversal or consolidation due to overbought conditions in the Stochastic Oscillator. The volatility is low, indicating a lack of significant price movements, while the volume indicators reflect indecision among investors.
Recommendation:
- Short-term Traders: Consider taking profits if the stock price reaches the upper Bollinger Band.
- Long-term Investors: Hold positions with a cautious approach, monitoring the Stochastic Oscillator for potential reversal signals.
- Risk Management: Set stop-loss orders to protect gains in case of a sudden downturn.
Overall, while the technical indicators point towards a sideways movement with a slight bullish bias, it is essential to monitor key levels and indicators for any potential shifts in market sentiment.