Technical Analysis of HYD 2024-05-10
Overview:
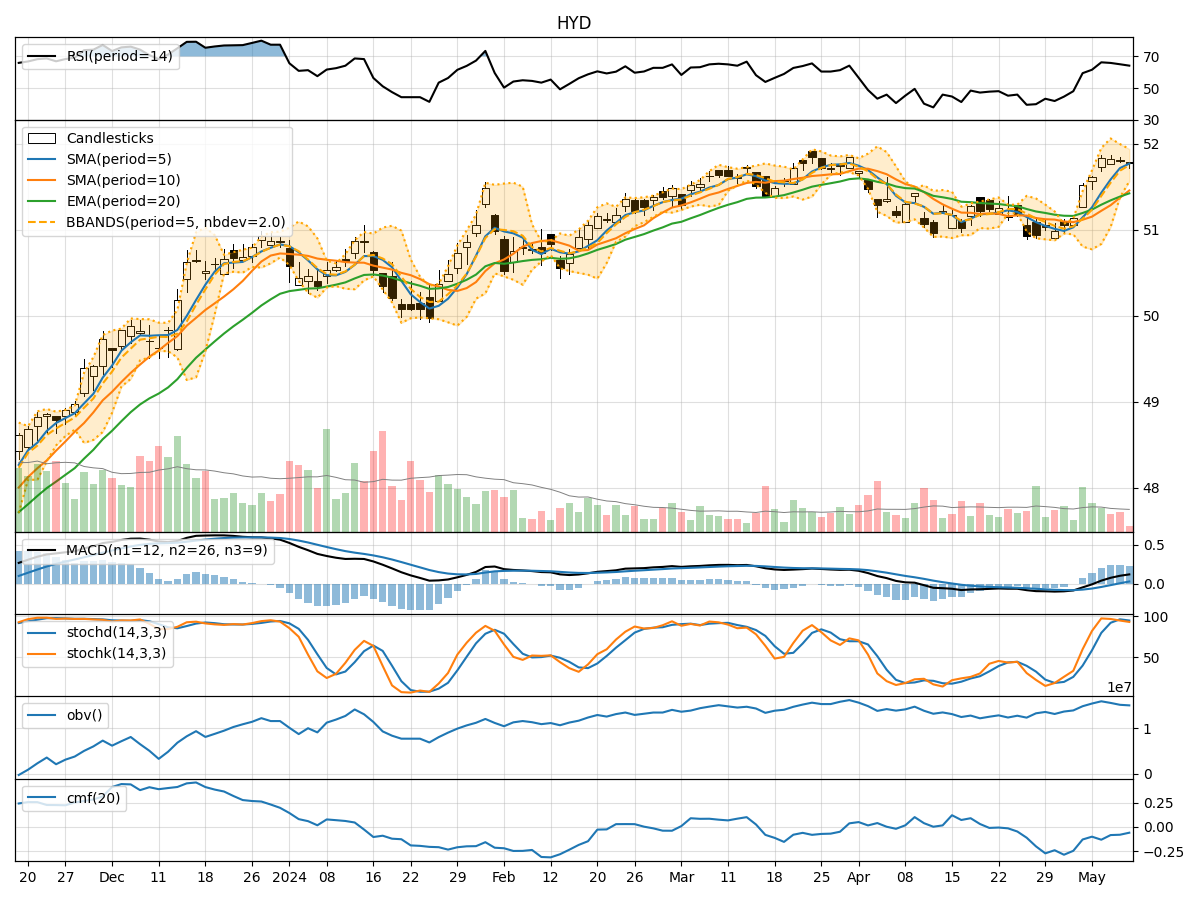
In the last 5 trading days, HYD stock has shown a relatively stable price movement with minor fluctuations. The trend indicators suggest a slightly bullish sentiment, supported by increasing moving averages and positive MACD values. Momentum indicators indicate a slightly overbought condition, while volatility indicators show a narrowing Bollinger Bands range. Volume indicators suggest a slight decrease in buying pressure.
Trend Indicators Analysis:
- Moving Averages (MA): The 5-day MA has been consistently above the 10-day SMA, indicating a short-term bullish trend.
- MACD: The MACD line has been consistently above the signal line, indicating bullish momentum.
Key Observation: The trend indicators suggest a bullish bias in the short term.
Momentum Indicators Analysis:
- Relative Strength Index (RSI): RSI values have been in the overbought territory, indicating a potential reversal or consolidation.
- Stochastic Oscillator: Both %K and %D values have been high, suggesting an overbought condition.
Key Observation: Momentum indicators signal a potential overbought scenario, which could lead to a price correction or consolidation.
Volatility Indicators Analysis:
- Bollinger Bands (BB): The Bollinger Bands have been narrowing, indicating decreasing volatility and a potential price breakout.
Key Observation: Volatility is decreasing, which could lead to a period of consolidation before a potential breakout.
Volume Indicators Analysis:
- On-Balance Volume (OBV): The OBV has shown a slight decrease, indicating a decrease in buying pressure.
- Chaikin Money Flow (CMF): The CMF has been negative, suggesting a lack of buying interest.
Key Observation: Volume indicators suggest a decrease in buying pressure, which could impact future price movements.
Conclusion:
Based on the analysis of technical indicators, the next few days for HYD stock could see sideways movement or a slight correction. The bullish trend indicated by moving averages and MACD may face resistance due to overbought conditions highlighted by momentum indicators. The decreasing volatility and volume indicators also support the possibility of a consolidation phase.
Recommendation: It is advisable to closely monitor price action and key support/resistance levels for potential entry or exit points. Consider implementing risk management strategies to navigate potential price fluctuations during this period of uncertainty.