Technical Analysis of HYDW 2024-05-10
Overview:
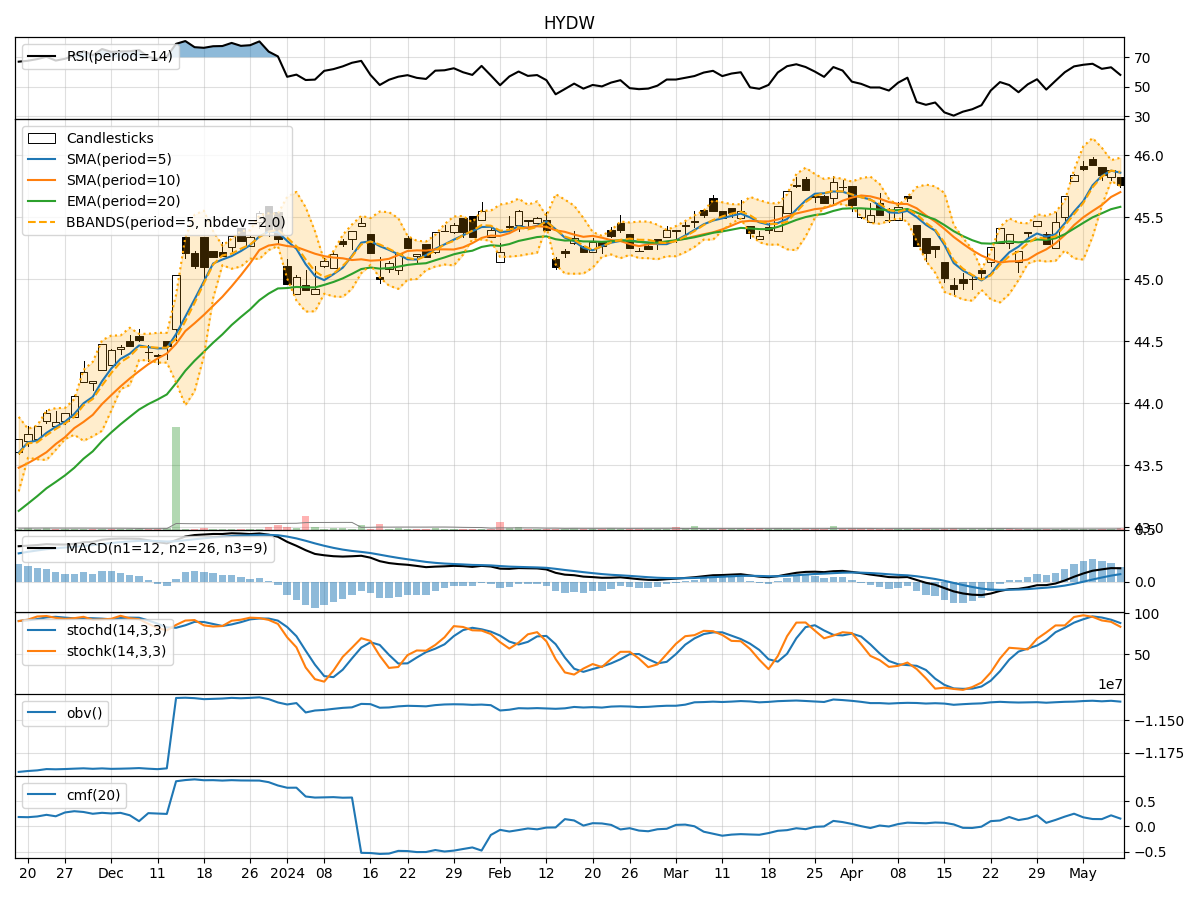
In analyzing the technical indicators for HYDW over the last 5 days, we will delve into the trend, momentum, volatility, and volume indicators to provide a comprehensive outlook on the possible stock price movement in the coming days.
Trend Indicators:
- Moving Averages (MA): The 5-day Moving Average (MA) has been consistently above the Simple Moving Average (SMA) and Exponential Moving Average (EMA), indicating a bullish trend.
- MACD: The MACD line has been consistently above the signal line, with both lines showing an upward trend, suggesting bullish momentum.
- Conclusion: The trend indicators point towards an upward movement in the stock price.
Momentum Indicators:
- RSI: The Relative Strength Index (RSI) has been fluctuating around the neutral zone, indicating a balanced momentum.
- Stochastic Oscillator: Both %K and %D have been gradually decreasing, suggesting a potential reversal in momentum.
- Conclusion: The momentum indicators signal a sideways movement in the stock price.
Volatility Indicators:
- Bollinger Bands (BB): The stock price has been trading within the Bollinger Bands, with the bands narrowing, indicating decreasing volatility.
- Conclusion: Volatility indicators suggest a consolidation phase in the stock price.
Volume Indicators:
- On-Balance Volume (OBV): The OBV has been fluctuating, indicating indecision among investors.
- Chaikin Money Flow (CMF): The CMF has been positive but not significantly strong, suggesting moderate buying pressure.
- Conclusion: Volume indicators point towards a neutral stance in the stock price.
Overall Conclusion:
Based on the analysis of trend, momentum, volatility, and volume indicators, the overall outlook for HYDW in the next few days is as follows: - Trend: Upward - Momentum: Sideways - Volatility: Consolidation - Volume: Neutral
Final Recommendation:
Considering the mixed signals from the various technical indicators, it is advisable to exercise caution in trading HYDW in the next few days. While the trend indicators suggest an upward movement, the momentum and volume indicators indicate a lack of strong conviction. Traders may consider waiting for clearer signals or implementing risk management strategies to navigate the potential uncertainty in the stock price movement.