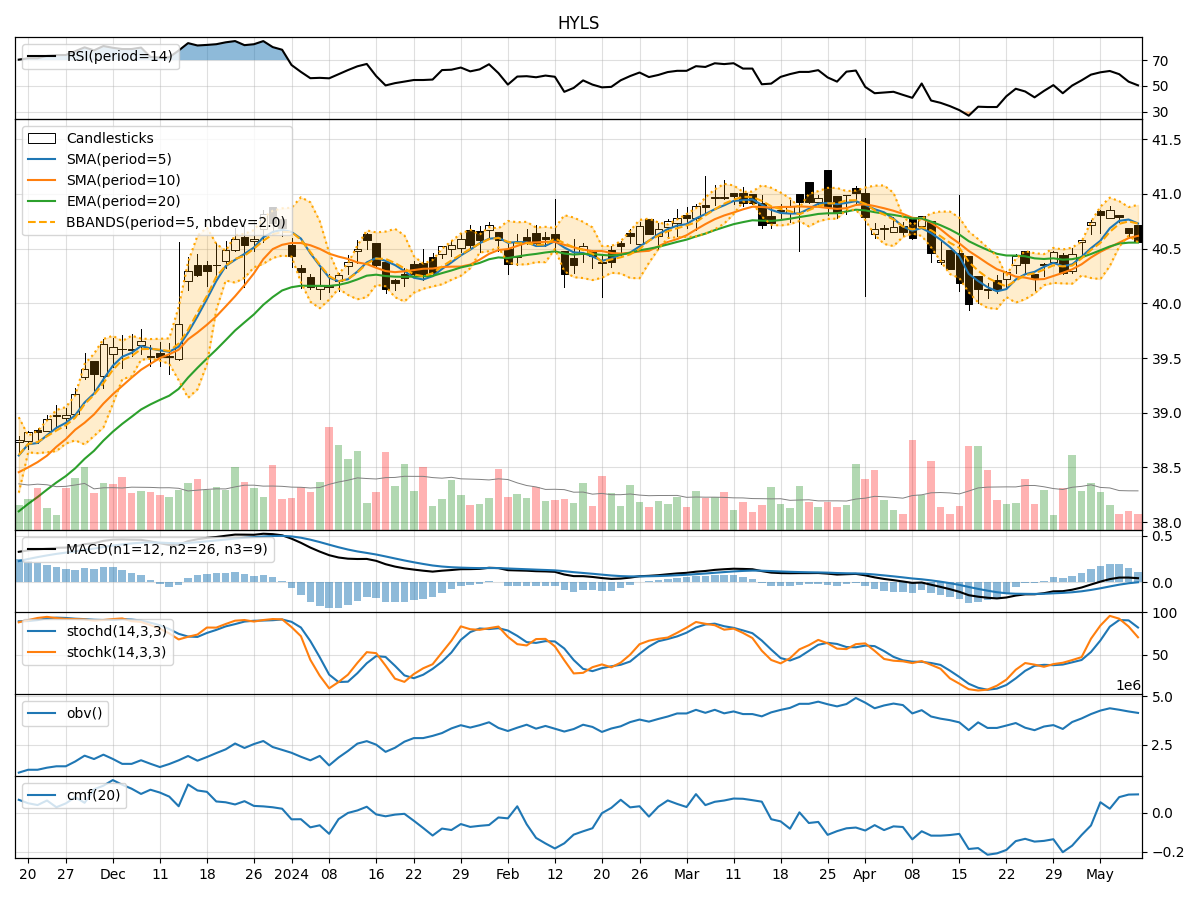
Technical Analysis of HYLS 2024-05-10
Overview:
In the last 5 trading days, HYLS stock has shown mixed signals across various technical indicators. The trend indicators suggest a relatively stable price movement, with the Moving Average Convergence Divergence (MACD) showing a slight positive momentum. Momentum indicators indicate a weakening trend, with the Relative Strength Index (RSI) and Stochastic Oscillator pointing towards potential bearish pressure. Volatility indicators show a narrowing Bollinger Bands, indicating a potential decrease in price fluctuations. Volume indicators suggest a consistent but not significant change in trading volume.
Trend Indicators:
- Moving Averages (MA) show a relatively stable price trend, with the 5-day MA slightly above the 10-day Simple Moving Average (SMA).
- Exponential Moving Average (EMA) indicates a gradual uptrend, but the difference between the short-term and long-term EMAs is not significant.
- MACD and its signal line are positive, suggesting a potential bullish momentum in the short term.
Momentum Indicators:
- RSI is above 50 but trending downwards, indicating a weakening bullish momentum.
- Stochastic Oscillator shows a decline in both %K and %D values, signaling a potential shift towards oversold conditions.
- Williams %R (Willams %R) is in the oversold territory, indicating a bearish sentiment in the market.
Volatility Indicators:
- Bollinger Bands are narrowing, suggesting a decrease in price volatility and a possible period of consolidation.
- The Bollinger Band Percentage (BBP) is relatively low, indicating that the stock price is currently trading near the lower band.
Volume Indicators:
- On-Balance Volume (OBV) shows a slight increase in buying pressure but not significant enough to indicate a strong bullish sentiment.
- Chaikin Money Flow (CMF) is positive, indicating that money is flowing into the stock, but the rate of inflow is not substantial.
Conclusion:
Based on the analysis of the technical indicators, the next few days for HYLS stock are likely to see sideways movement with a slight bearish bias. The trend indicators suggest a stable price trend with a potential bullish momentum in the short term. However, the weakening momentum indicated by the RSI and Stochastic Oscillator, along with the oversold conditions highlighted by Williams %R, point towards a possible downward correction or consolidation phase. The narrowing Bollinger Bands further support the expectation of reduced volatility and a period of price stabilization.
Recommendation: It is advisable for investors to closely monitor the price action and key support levels. Consider implementing risk management strategies to navigate potential downside risks in the current market environment.