Technical Analysis of HYSA 2024-05-10
Overview:
In analyzing the technical indicators for HYSA stock over the last 5 days, we will delve into the trend, momentum, volatility, and volume indicators to provide a comprehensive outlook on the possible stock price movement in the coming days. By examining these key indicators, we aim to offer valuable insights and predictions to guide your investment decisions.
Trend Analysis:
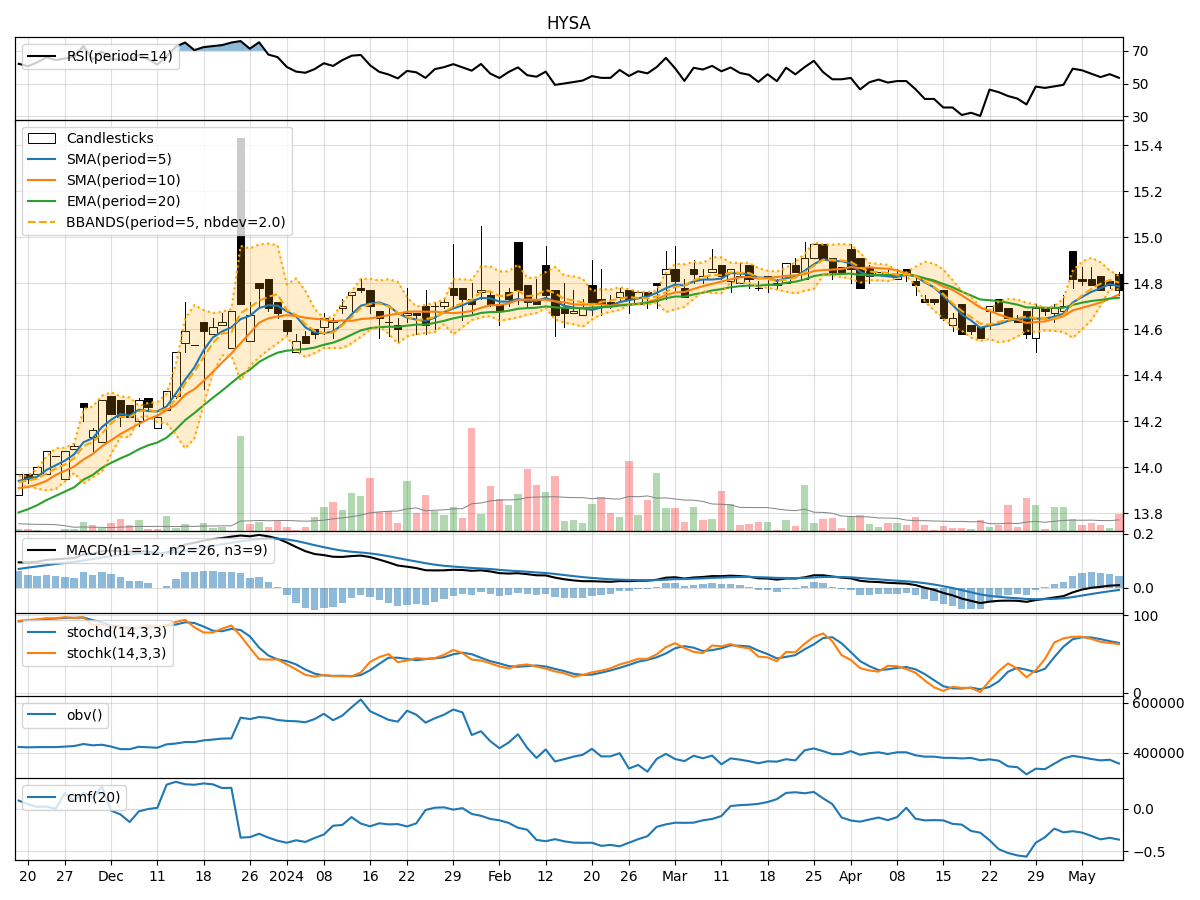
- Moving Averages (MA): The 5-day MA has been fluctuating around the closing prices, indicating short-term price trends. The SMA(10) and EMA(20) have shown a slight upward trend, suggesting a potential bullish sentiment.
- MACD: The MACD line has been positive, indicating a bullish momentum in the stock price. The MACD Histogram has been decreasing but remains above the signal line, signaling a potential consolidation phase.
- RSI: The RSI has been fluctuating around the 50 level, indicating a neutral sentiment in the stock.
Momentum Analysis:
- Stochastic Oscillator: The Stochastic Oscillator has been gradually decreasing, approaching the oversold territory. This could suggest a potential reversal in the stock price movement.
- Williams %R: The Williams %R indicator has been hovering in the oversold region, indicating a possible buying opportunity in the stock.
Volatility Analysis:
- Bollinger Bands: The Bollinger Bands have been narrowing, indicating decreasing volatility in the stock price. This could precede a period of consolidation or a potential breakout.
- Average True Range (ATR): The ATR has been decreasing, suggesting a decline in price volatility.
Volume Analysis:
- On-Balance Volume (OBV): The OBV has been fluctuating, indicating a balance between buying and selling pressure in the stock.
- Chaikin Money Flow (CMF): The CMF has been negative, suggesting a bearish sentiment in the stock.
Conclusion:
Based on the analysis of the technical indicators, the stock price of HYSA is likely to experience sideways movement in the coming days. The trend indicators show a potential bullish sentiment, supported by the positive MACD and slight upward trend in moving averages. However, the momentum indicators suggest a possible reversal in the stock price, as both the Stochastic Oscillator and Williams %R indicate oversold conditions. The volatility indicators point towards a period of consolidation, with decreasing volatility levels. The volume indicators reflect a balance between buying and selling pressure, with a slightly bearish sentiment indicated by the CMF.
Recommendation:
Considering the mixed signals from the technical indicators, it is advisable to exercise caution in trading HYSA stock in the near term. Traders may consider waiting for more clarity in price direction before making significant investment decisions. Monitoring key support and resistance levels, as well as any potential breakout patterns, can provide valuable insights for future trading strategies.