Technical Analysis of IBDW 2024-05-10
Overview:
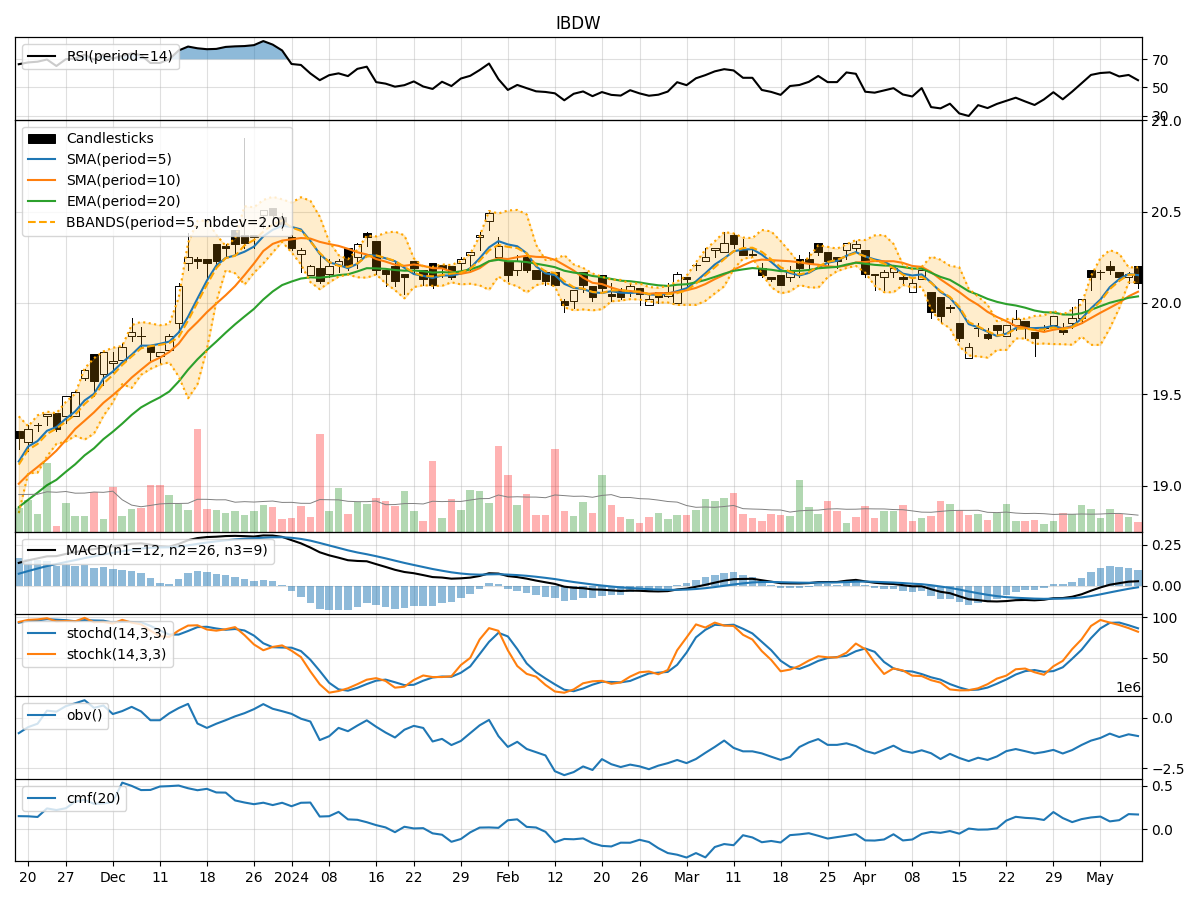
In the last 5 trading days, the stock has shown a relatively stable price movement with minor fluctuations. The trend indicators suggest a slightly bullish sentiment, supported by moving averages and MACD indicators. Momentum indicators indicate a neutral to slightly bearish momentum, while volatility indicators show a narrowing of the Bollinger Bands, indicating potential consolidation. Volume indicators suggest a mixed sentiment with fluctuations in On-Balance Volume (OBV) and Chaikin Money Flow (CMF).
Trend Indicators:
- Moving Averages (MA): The 5-day MA is slightly above the 10-day SMA, indicating a short-term bullish trend.
- MACD: The MACD line is above the signal line, suggesting a bullish momentum.
- EMA: The EMA is trending upwards, supporting the bullish sentiment.
Momentum Indicators:
- RSI: The RSI is in the neutral zone, indicating neither overbought nor oversold conditions.
- Stochastic Oscillator: Both %K and %D are declining, suggesting a bearish momentum.
- Williams %R: The indicator is in the oversold territory, indicating a potential reversal.
Volatility Indicators:
- Bollinger Bands (BB): The bands are narrowing, indicating decreasing volatility and a possible period of consolidation.
- BB %B: The %B is close to 0.5, suggesting a balanced market sentiment.
Volume Indicators:
- On-Balance Volume (OBV): The OBV has shown fluctuations, indicating mixed buying and selling pressure.
- Chaikin Money Flow (CMF): The CMF is positive but fluctuating, reflecting uncertainty in the market sentiment.
Key Observations:
- The trend indicators suggest a bullish bias in the short term.
- Momentum indicators show a neutral to slightly bearish momentum.
- Volatility indicators point towards a potential consolidation phase.
- Volume indicators indicate mixed buying and selling pressure.
Conclusion:
Based on the analysis of the technical indicators, the next few days' possible stock price movement is likely to be sideways with a slight upward bias. The bullish trend indicated by moving averages and MACD may support some upward movement, but the bearish momentum from stochastic indicators could limit significant gains. The narrowing Bollinger Bands suggest a period of consolidation, while mixed volume indicators indicate a lack of strong conviction in either direction. Traders should be cautious and consider waiting for clearer signals before making significant trading decisions.