Technical Analysis of IBIC 2024-05-10
Overview:
In analyzing the technical indicators for IBIC stock over the last 5 days, we will delve into the trend, momentum, volatility, and volume indicators to provide a comprehensive outlook on the possible future stock price movement. By examining these key indicators, we aim to offer valuable insights and recommendations for potential trading strategies.
Trend Indicators:
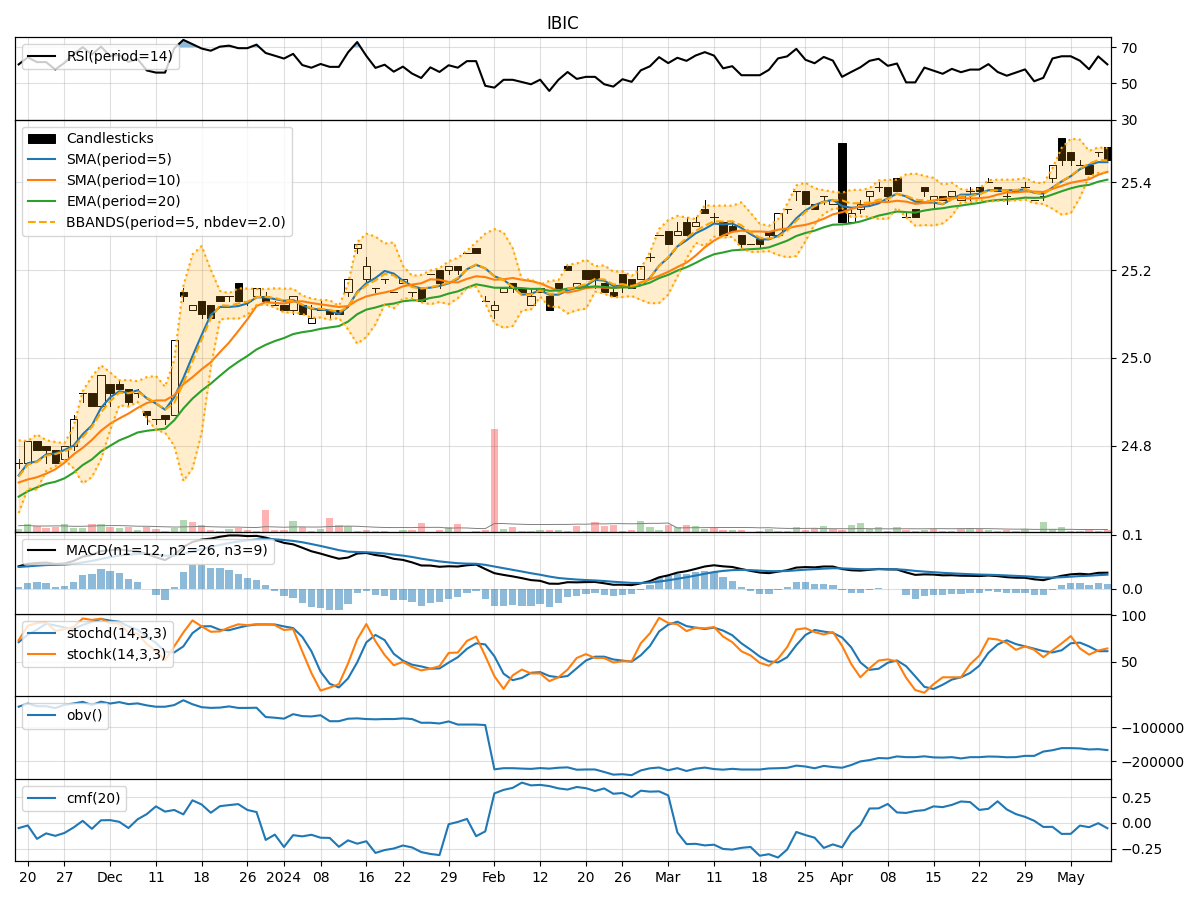
- Moving Averages (MA): The 5-day Moving Average (MA) has been relatively stable around the current stock price, indicating a neutral trend.
- MACD: The Moving Average Convergence Divergence (MACD) has shown slight fluctuations but remains close to zero, suggesting a lack of strong trend direction.
- MACD Histogram: The MACD Histogram has been hovering around the zero line, indicating a balanced market sentiment.
Momentum Indicators:
- RSI: The Relative Strength Index (RSI) has fluctuated within the neutral range, indicating a lack of strong buying or selling pressure.
- Stochastic Oscillator: Both %K and %D lines of the Stochastic Oscillator have shown mixed signals, reflecting indecision in the market.
- Williams %R: The Williams %R indicator has also been oscillating near the oversold territory, suggesting a potential reversal in the short term.
Volatility Indicators:
- Bollinger Bands: The Bollinger Bands have shown narrowing bands, indicating decreasing volatility and a potential period of consolidation.
- Bollinger %B: The %B indicator has been fluctuating within a narrow range, reflecting a balanced market sentiment.
Volume Indicators:
- On-Balance Volume (OBV): The OBV indicator has shown a slight decline, suggesting a decrease in buying pressure.
- Chaikin Money Flow (CMF): The CMF has been negative, indicating a lack of strong inflow of money into the stock.
Key Observations:
- The trend indicators suggest a lack of clear trend direction, with the stock price hovering around the moving averages.
- Momentum indicators indicate a neutral stance with mixed signals, reflecting indecision among traders.
- Volatility indicators point towards decreasing volatility and a potential period of consolidation.
- Volume indicators show a slight decline in buying pressure and a lack of strong inflow of money into the stock.
Conclusion:
Based on the analysis of the technical indicators, the next few days for IBIC stock are likely to see sideways movement with a consolidation phase. The lack of strong trend direction, mixed momentum signals, decreasing volatility, and subdued buying pressure indicate a period of indecision and potential price stabilization. Traders may consider adopting a cautious approach and wait for clearer signals before making significant trading decisions.