Technical Analysis of IBIG 2024-05-10
Overview:
In analyzing the technical indicators for IBIG stock over the last 5 days, we will delve into the trend, momentum, volatility, and volume indicators to provide a comprehensive outlook on the possible stock price movement in the coming days.
Trend Indicators:
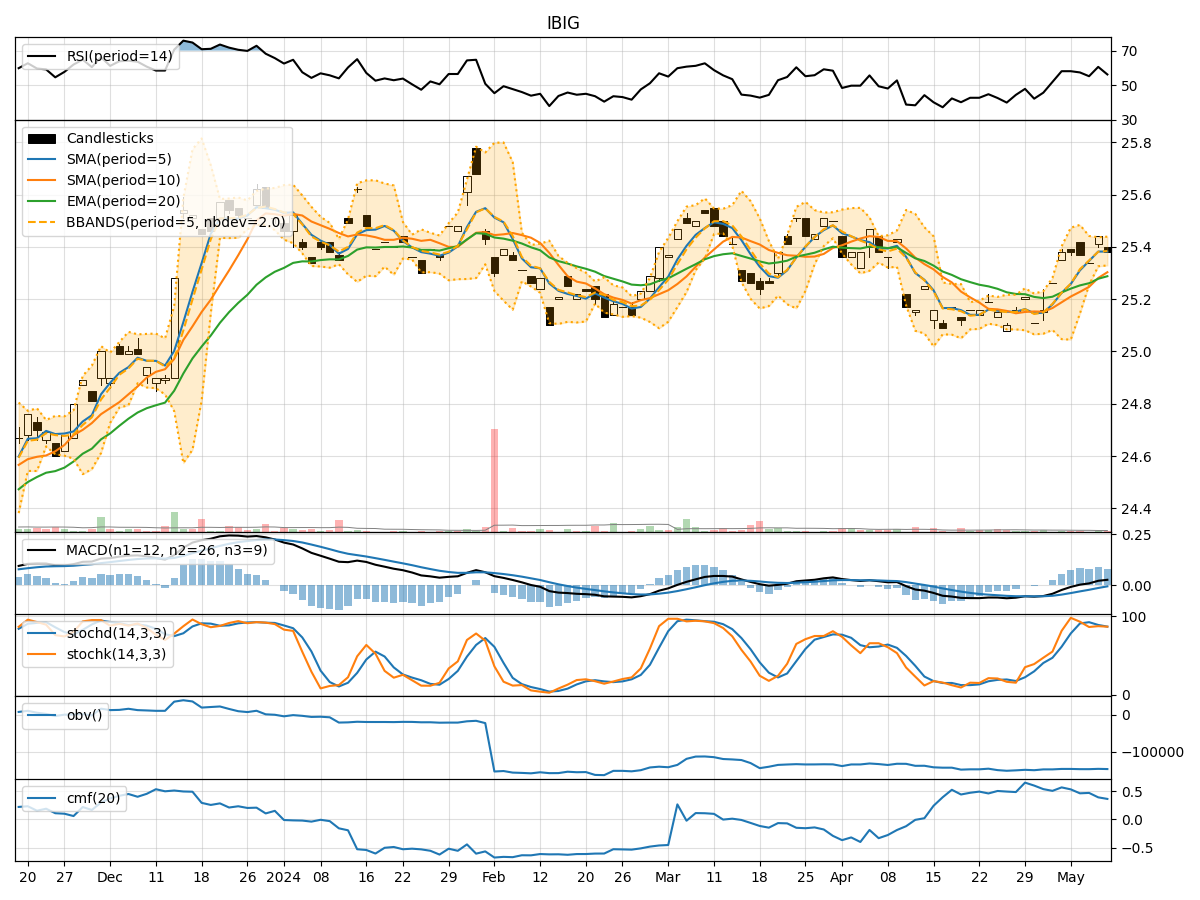
- Moving Averages (MA): The 5-day MA has been consistently above the closing price, indicating a short-term uptrend.
- MACD: The MACD line has been positive and above the signal line, suggesting bullish momentum.
- EMA: The EMA has been trending upwards, supporting the bullish sentiment.
Momentum Indicators:
- RSI: The RSI has been fluctuating around the 50 level, indicating a neutral momentum.
- Stochastic Oscillator: Both %K and %D have been in the overbought zone, suggesting a potential reversal.
- Williams %R: The indicator has been in the oversold territory, signaling a possible buying opportunity.
Volatility Indicators:
- Bollinger Bands: The stock price has been trading within the bands, indicating a period of consolidation.
- Bollinger %B: The %B value has been fluctuating around 0.5, reflecting a balanced market sentiment.
Volume Indicators:
- On-Balance Volume (OBV): The OBV has been showing mixed signals, with no clear trend in volume accumulation.
- Chaikin Money Flow (CMF): The CMF has been hovering around the neutral level, suggesting indecision among investors.
Key Observations:
- The trend indicators point towards a bullish bias, supported by the moving averages and MACD.
- Momentum indicators show conflicting signals, with RSI neutral, Stochastic overbought, and Williams %R oversold.
- Volatility indicators indicate a period of consolidation with no clear direction.
- Volume indicators lack a definitive trend, reflecting uncertainty in market participation.
Conclusion:
Based on the analysis of the technical indicators, the next few days for IBIG stock are likely to see sideways movement with a potential for a slight upward bias. The bullish trend indicated by moving averages and MACD may be hindered by conflicting signals from momentum indicators and the lack of clear direction in volume and volatility indicators. Traders should exercise caution and closely monitor key levels for potential breakout or reversal signals.