Technical Analysis of IBIH 2024-05-10
Overview:
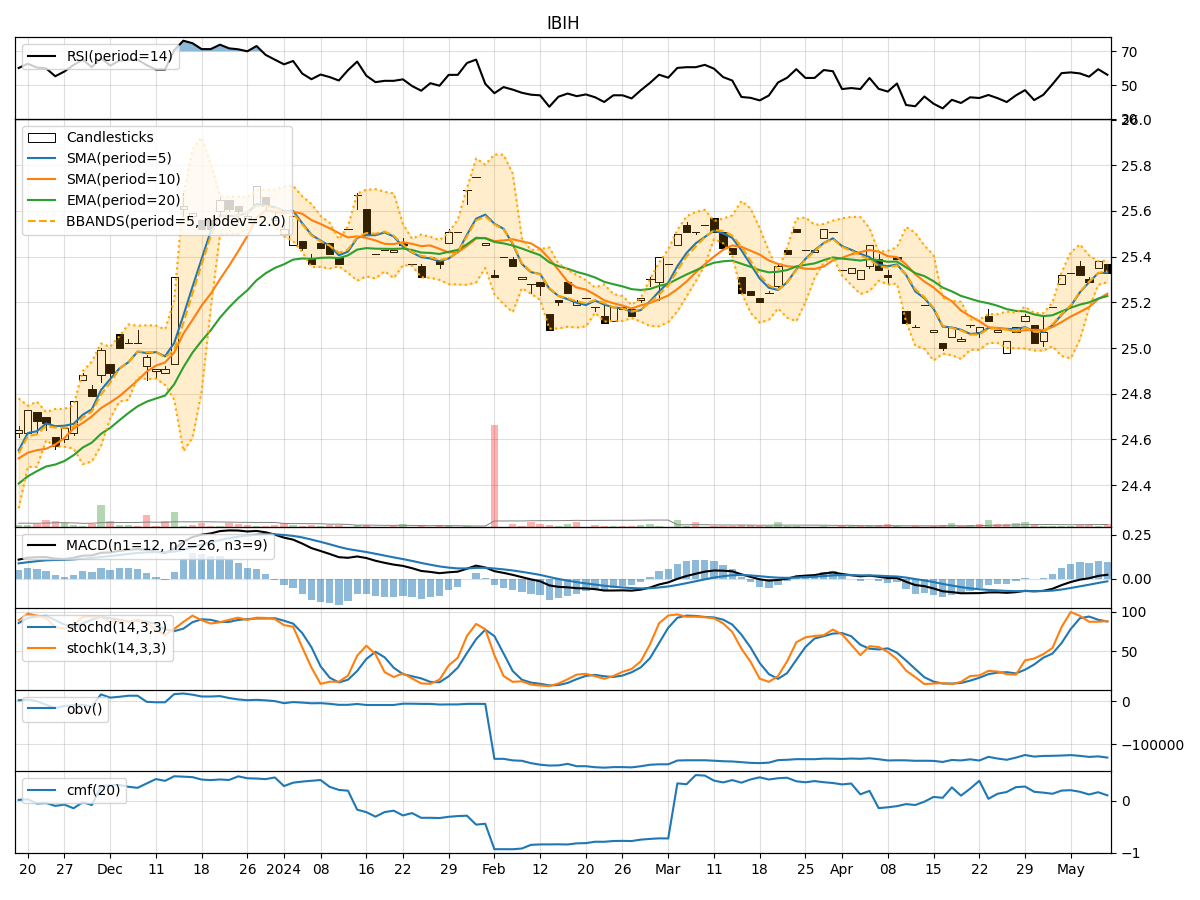
In analyzing the technical indicators for IBIH stock over the last 5 days, we will delve into the trends, momentum, volatility, and volume aspects to provide a comprehensive outlook on the possible stock price movement in the coming days. By examining key indicators such as moving averages, MACD, RSI, Bollinger Bands, and OBV, we aim to offer valuable insights and predictions for potential price action.
Trend Analysis:
- Moving Averages (MA): The 5-day MA has been consistently above the closing prices, indicating a short-term uptrend.
- MACD: The MACD line has been positive and increasing, suggesting bullish momentum.
- EMA: The EMA has been trending upwards, supporting the bullish sentiment.
- Conclusion: The trend indicators point towards an upward movement in the stock price.
Momentum Analysis:
- RSI: The RSI has been fluctuating around the 50 level, indicating neutral momentum.
- Stochastic Oscillator: Both %K and %D have been hovering around the overbought territory, suggesting potential for a pullback.
- Williams %R: The indicator has shown mixed signals, oscillating between overbought and oversold levels.
- Conclusion: Momentum indicators suggest a neutral to slightly bearish outlook.
Volatility Analysis:
- Bollinger Bands: The stock price has been trading within the bands, indicating normal volatility.
- Conclusion: Volatility indicators suggest a sideways movement in the stock price.
Volume Analysis:
- On-Balance Volume (OBV): The OBV has shown mixed movements, not providing a clear direction.
- Chaikin Money Flow (CMF): The CMF has been positive but declining, signaling potential selling pressure.
- Conclusion: Volume indicators suggest a lack of strong conviction in the stock price direction.
Overall Conclusion:
Based on the analysis of trend, momentum, volatility, and volume indicators, the next few days' possible stock price movement for IBIH is likely to be sideways with a slight bearish bias. While the trend indicators point towards an upward movement, momentum indicators suggest a neutral to bearish outlook. Volatility indicators indicate a sideways trend, and volume indicators show a lack of strong conviction in either direction.
Recommendation:
Given the mixed signals from the technical indicators, it is advisable for investors to exercise caution and closely monitor the price action. Consider setting tight stop-loss levels to manage risk effectively. Additionally, waiting for more clarity in the market sentiment before making significant trading decisions would be prudent.
Disclaimer:
Remember that technical analysis is not a guaranteed predictor of future price movements, and other fundamental factors can influence stock prices. It is essential to conduct thorough research and consider multiple indicators before making any investment decisions. Consulting with a financial advisor can provide personalized insights tailored to your specific investment goals and risk tolerance level.