Technical Analysis of IBIT 2024-05-10
Overview:
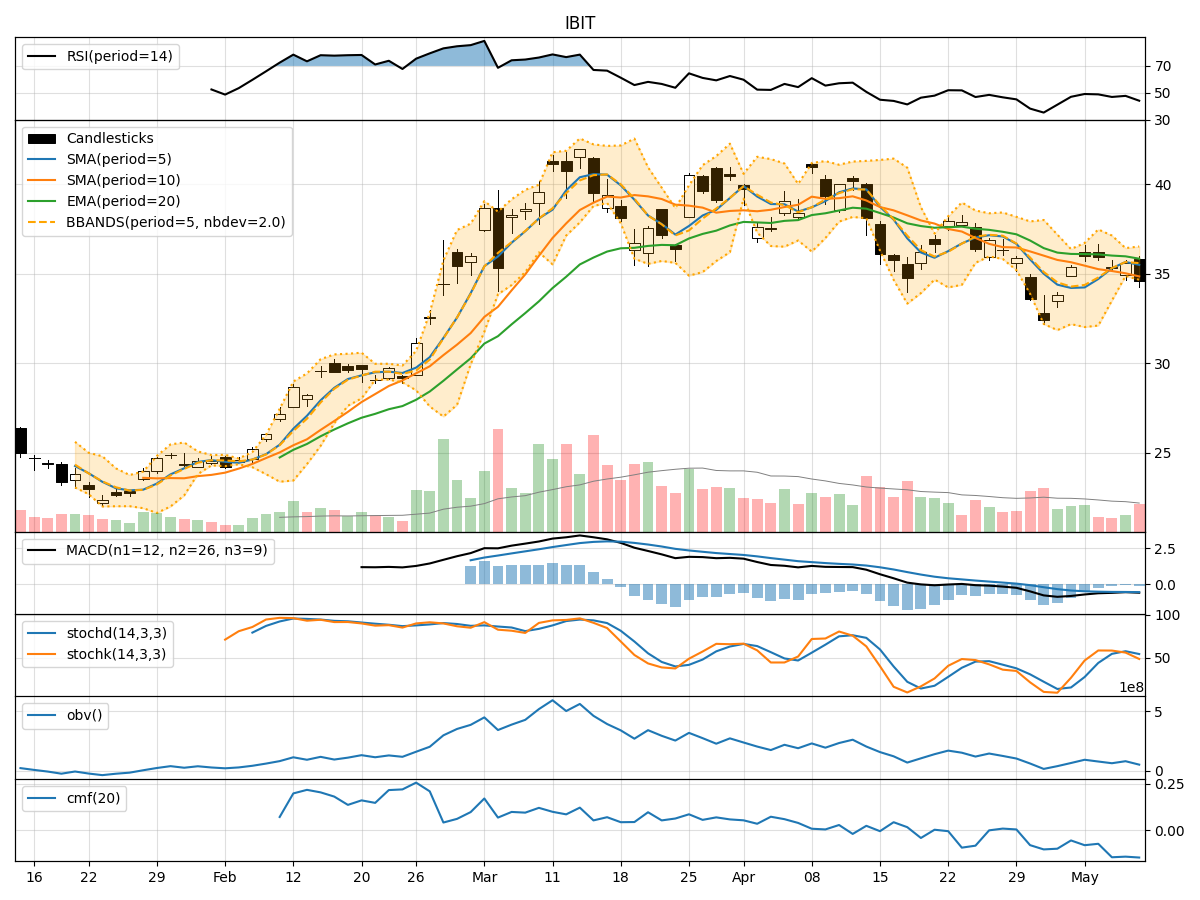
In analyzing the technical indicators for IBIT stock over the last 5 days, we will delve into the trend, momentum, volatility, and volume indicators to provide a comprehensive outlook on the possible stock price movement in the coming days. By examining these key indicators, we aim to offer valuable insights and predictions for potential investors.
Trend Indicators:
- Moving Averages (MA): The 5-day moving average has been declining, indicating a short-term bearish trend.
- MACD (Moving Average Convergence Divergence): The MACD line has been consistently below the signal line, suggesting a bearish momentum.
- EMA (Exponential Moving Average): The EMA has been trending downwards, reinforcing the bearish sentiment in the short to medium term.
Momentum Indicators:
- RSI (Relative Strength Index): The RSI has been hovering around the mid-level, indicating a lack of strong momentum in either direction.
- Stochastic Oscillator: Both %K and %D have been fluctuating, not providing a clear signal on the stock's momentum.
- Williams %R (Willams Percentage Range): The Williams %R is in oversold territory, suggesting a potential reversal or consolidation.
Volatility Indicators:
- Bollinger Bands: The stock price has been trading within the lower Bollinger Band, indicating a period of low volatility.
- Bollinger %B: The %B is close to 0, suggesting the stock is oversold and may see a potential bounce in the near future.
Volume Indicators:
- On-Balance Volume (OBV): The OBV has been declining, indicating selling pressure in the stock.
- Chaikin Money Flow (CMF): The CMF has been negative, reflecting a lack of buying interest in the stock.
Key Observations and Opinions:
- Trend: The trend indicators point towards a bearish sentiment in the short term.
- Momentum: Momentum indicators are mixed, with no clear direction in the stock's momentum.
- Volatility: Volatility is low, suggesting a period of consolidation or potential reversal.
- Volume: Selling pressure is evident based on the declining OBV and negative CMF.
Conclusion:
Based on the analysis of the technical indicators, the next few days for IBIT stock are likely to see further downward movement in the short term. The bearish trend, lack of strong momentum, low volatility, and selling pressure indicated by volume indicators all point towards a potential continuation of the current downtrend. Investors should exercise caution and consider waiting for more definitive signals before making any trading decisions.