Technical Analysis of IBMN 2024-05-10
Overview:
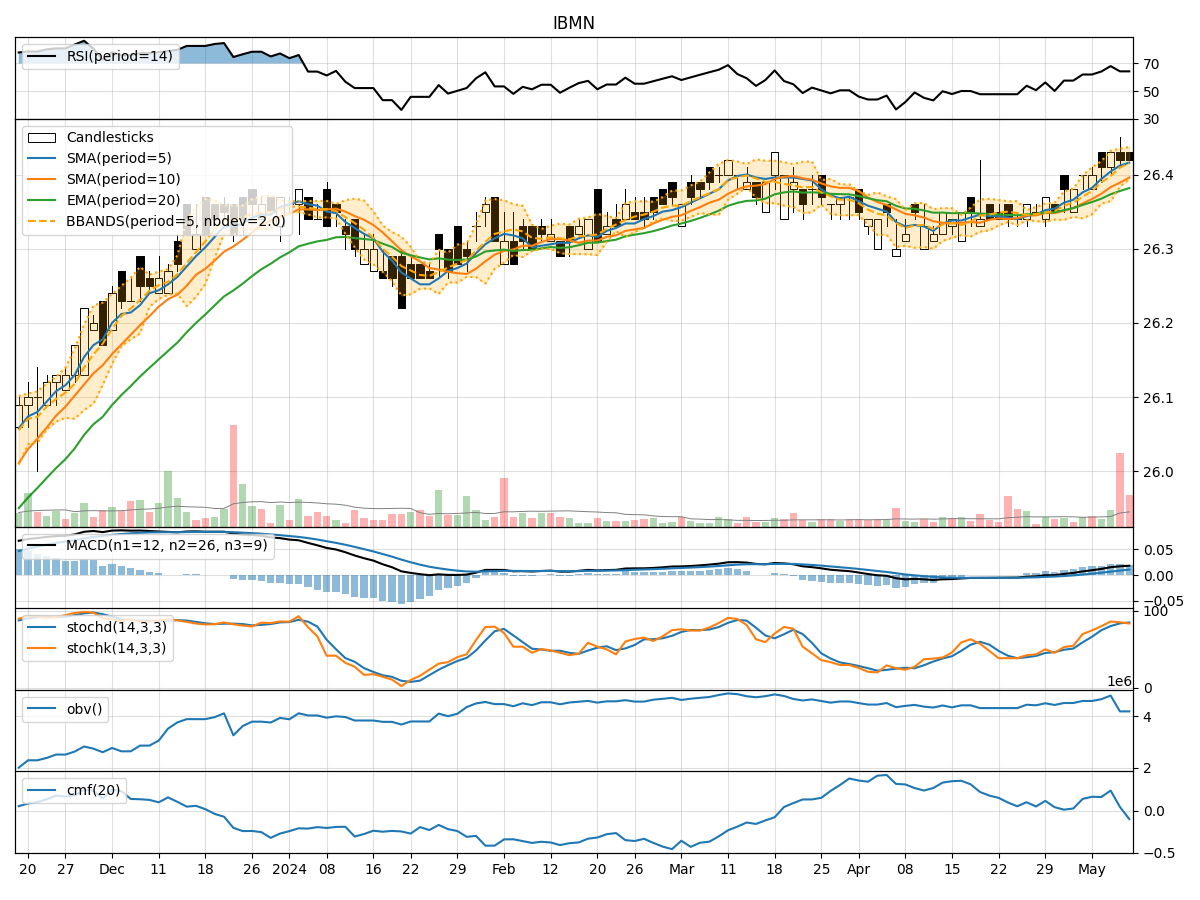
In analyzing the technical indicators for IBMN over the last 5 days, we will delve into the trend, momentum, volatility, and volume indicators to provide a comprehensive outlook on the possible stock price movement. By examining these key aspects, we aim to offer valuable insights and predictions for the upcoming days.
Trend Analysis:
- Moving Averages (MA): The 5-day MA has been consistently above the closing prices, indicating a short-term uptrend.
- MACD: The MACD line has been above the signal line, suggesting bullish momentum.
- RSI: The RSI values have been fluctuating around the overbought territory, indicating potential strength in the current trend.
Key Observation: The trend indicators point towards a bullish sentiment in the short term.
Momentum Analysis:
- Stochastic Oscillator: The Stochastic indicators have been in the overbought region, signaling potential for a reversal.
- Williams %R: The Williams %R values have been consistently in the oversold territory, indicating a potential buying opportunity.
Key Observation: Momentum indicators suggest a mixed outlook with a possibility of a short-term pullback.
Volatility Analysis:
- Bollinger Bands (BB): The stock price has been trading within the upper Bollinger Band, indicating increased volatility.
- Bollinger Band %B: The %B values have been fluctuating around the upper band, suggesting potential overbought conditions.
Key Observation: Volatility indicators point towards increased volatility in the near term.
Volume Analysis:
- On-Balance Volume (OBV): The OBV has shown mixed signals, indicating indecision among market participants.
- Chaikin Money Flow (CMF): The CMF values have been positive but decreasing, suggesting weakening buying pressure.
Key Observation: Volume indicators reflect uncertainty in market participation.
Conclusion:
Based on the analysis of trend, momentum, volatility, and volume indicators, the next few days for IBMN could see increased volatility with a bullish bias in the short term. However, the momentum indicators hint at a potential pullback due to overbought conditions. Traders should closely monitor key support and resistance levels for potential entry and exit points.
Recommendation:
- Short-term Traders: Consider taking profits on existing positions as the stock may experience a pullback.
- Long-term Investors: Monitor the price action for potential buying opportunities on dips.
- Risk Management: Implement stop-loss orders to protect gains and manage downside risk effectively.
In conclusion, while the overall trend remains bullish, caution is advised due to the potential for a short-term correction. Stay vigilant and adapt your trading strategy accordingly to navigate the market dynamics effectively.