Technical Analysis of IDV 2024-05-10
Overview:
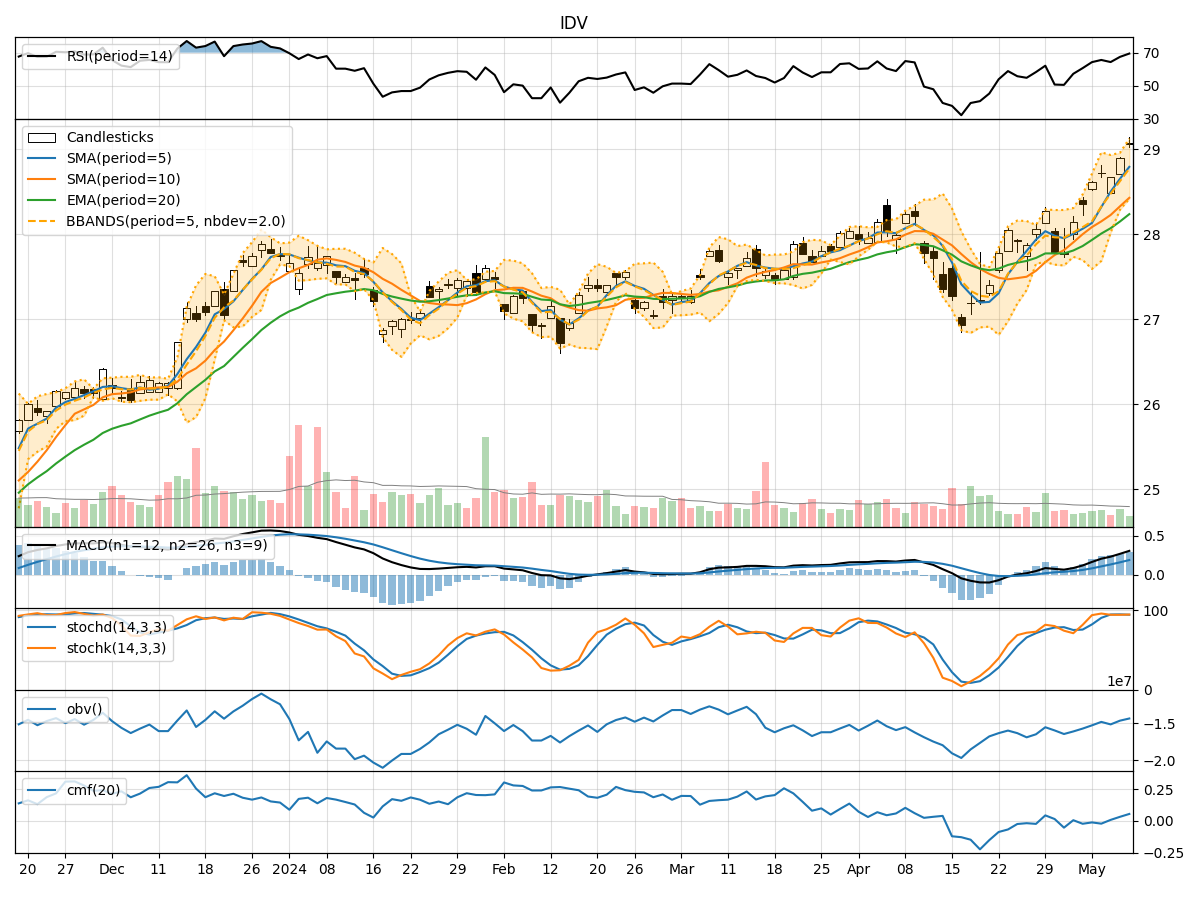
In the last 5 trading days, IDV stock has shown a consistent uptrend in its price movement. The moving averages have been trending upwards, indicating a positive momentum. The MACD and RSI are also showing bullish signals. However, the stock is currently trading near its upper Bollinger Band, suggesting a potential overbought condition. Let's delve deeper into each category of technical indicators to provide a comprehensive analysis and make a prediction for the next few days.
Trend Indicators:
- Moving Averages (MA): The 5-day MA has been consistently above the 10-day SMA, indicating a short-term bullish trend. The EMA(20) is also trending upwards, supporting the bullish momentum.
- MACD: The MACD line has been above the signal line for the past 5 days, indicating a bullish trend. The MACD histogram is also showing an increasing bullish momentum.
Momentum Indicators:
- RSI: The RSI has been consistently above 50, indicating bullish momentum. However, it is important to note that the RSI is approaching overbought levels, which might signal a potential reversal.
- Stochastic Oscillator: Both %K and %D lines are in the overbought zone, suggesting that the stock may be overvalued in the short term.
Volatility Indicators:
- Bollinger Bands: The stock price is currently near the upper Bollinger Band, indicating a potential overbought condition. This could lead to a short-term pullback or consolidation.
- Bollinger %B: The %B is above 0.8, indicating that the stock is trading at the upper end of its recent price range.
Volume Indicators:
- On-Balance Volume (OBV): The OBV has been steadily increasing over the past 5 days, indicating strong buying pressure in the stock.
- Chaikin Money Flow (CMF): The CMF(20) is positive, suggesting that money is flowing into the stock.
Key Observations and Opinions:
- Trend: The stock is in a strong uptrend based on moving averages and MACD.
- Momentum: The RSI and Stochastic Oscillator suggest bullish momentum, but caution is advised due to potential overbought conditions.
- Volatility: The stock is currently overbought based on Bollinger Bands, indicating a possible short-term reversal.
- Volume: Strong buying pressure is reflected in increasing OBV and positive CMF.
Conclusion:
Based on the analysis of technical indicators, the next few days' possible stock price movement for IDV is likely to experience a short-term pullback or consolidation. The stock is showing signs of being overbought, especially near the upper Bollinger Band, which could lead to a temporary reversal in price. Traders should exercise caution and consider taking profits or waiting for a better entry point before initiating new long positions.