Technical Analysis of IGSB 2024-05-10
Overview:
In analyzing the technical indicators for IGSB over the last 5 days, we will delve into the trends, momentum, volatility, and volume indicators to provide a comprehensive outlook on the possible stock price movement. By examining these key aspects, we aim to offer valuable insights and predictions for the upcoming days.
Trend Analysis:
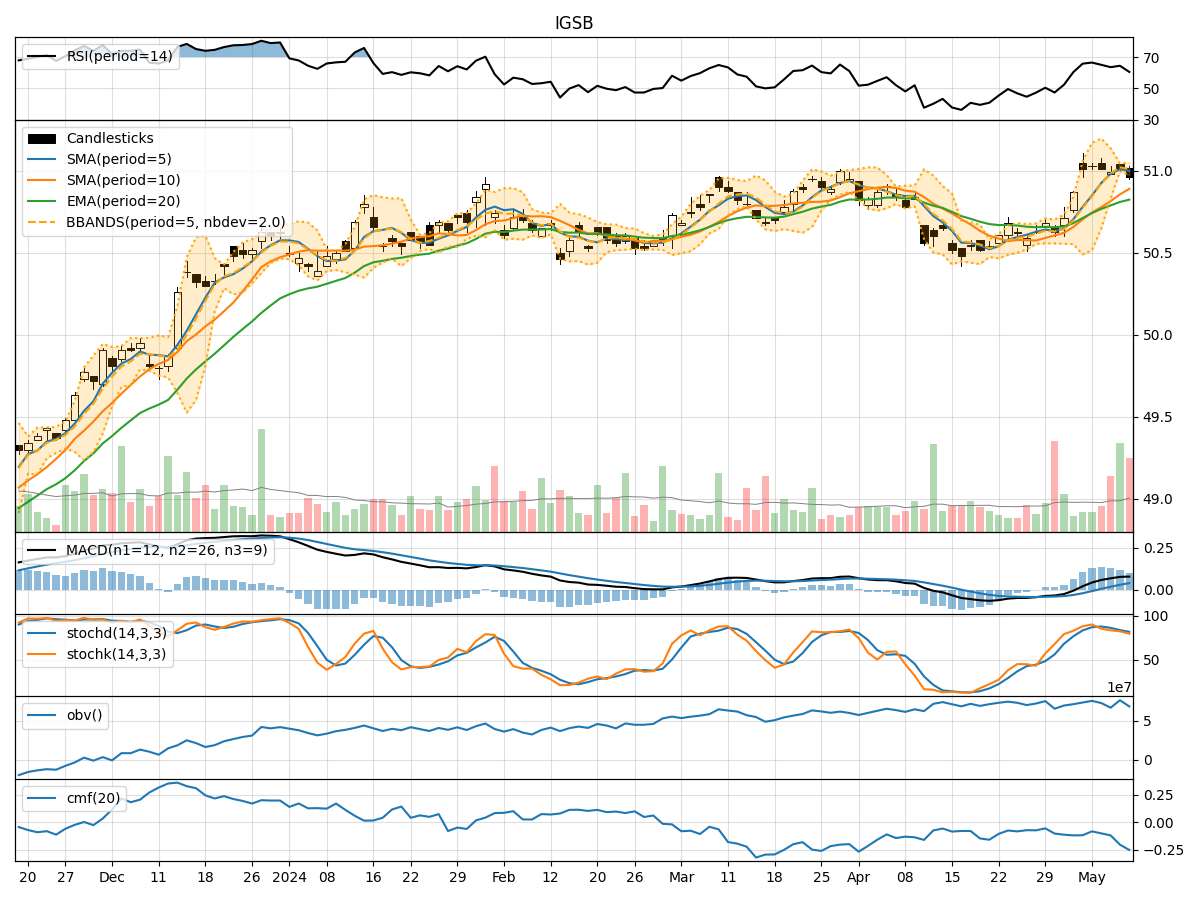
- Moving Averages (MA): The 5-day Moving Average (MA) has been relatively stable around the $51 mark, indicating a neutral trend in the short term.
- MACD: The Moving Average Convergence Divergence (MACD) shows a positive trend with the MACD line consistently above the signal line, suggesting bullish momentum.
- EMA: The Exponential Moving Average (EMA) has been gradually increasing, reflecting a positive price trend.
Momentum Analysis:
- RSI: The Relative Strength Index (RSI) has been fluctuating around the mid-range, indicating a lack of strong momentum in either direction.
- Stochastic Oscillator: Both %K and %D values have been declining, signaling a potential bearish momentum.
- Williams %R: The Williams %R is in the oversold territory, suggesting a possible reversal in the short term.
Volatility Analysis:
- Bollinger Bands (BB): The Bollinger Bands have been narrowing, indicating decreasing volatility and a potential price breakout in the near future.
- Bollinger %B: The %B indicator is hovering around the middle band, suggesting a period of consolidation.
Volume Analysis:
- On-Balance Volume (OBV): The OBV has been fluctuating, indicating mixed buying and selling pressure.
- Chaikin Money Flow (CMF): The CMF has been negative, reflecting a bearish money flow trend.
Conclusion:
Based on the analysis of the technical indicators, the next few days for IGSB could see sideways movement with a slight bearish bias. The lack of strong momentum, coupled with narrowing Bollinger Bands and negative CMF, suggests a period of consolidation with a potential downside risk. Traders should exercise caution and consider waiting for a clearer trend confirmation before making significant trading decisions.
Key Points:
- Trend: Neutral with a slight bullish bias.
- Momentum: Lackluster with a potential bearish reversal.
- Volatility: Decreasing volatility, signaling a possible breakout.
- Volume: Mixed buying and selling pressure, with a bearish money flow trend.
In conclusion, while the technical indicators do not provide a definitive direction, the overall outlook leans towards a sideways to slightly bearish movement for IGSB in the coming days. It is essential for traders to monitor key levels and wait for confirmation signals before taking any significant positions.