Technical Analysis of IJH 2024-05-10
Overview:
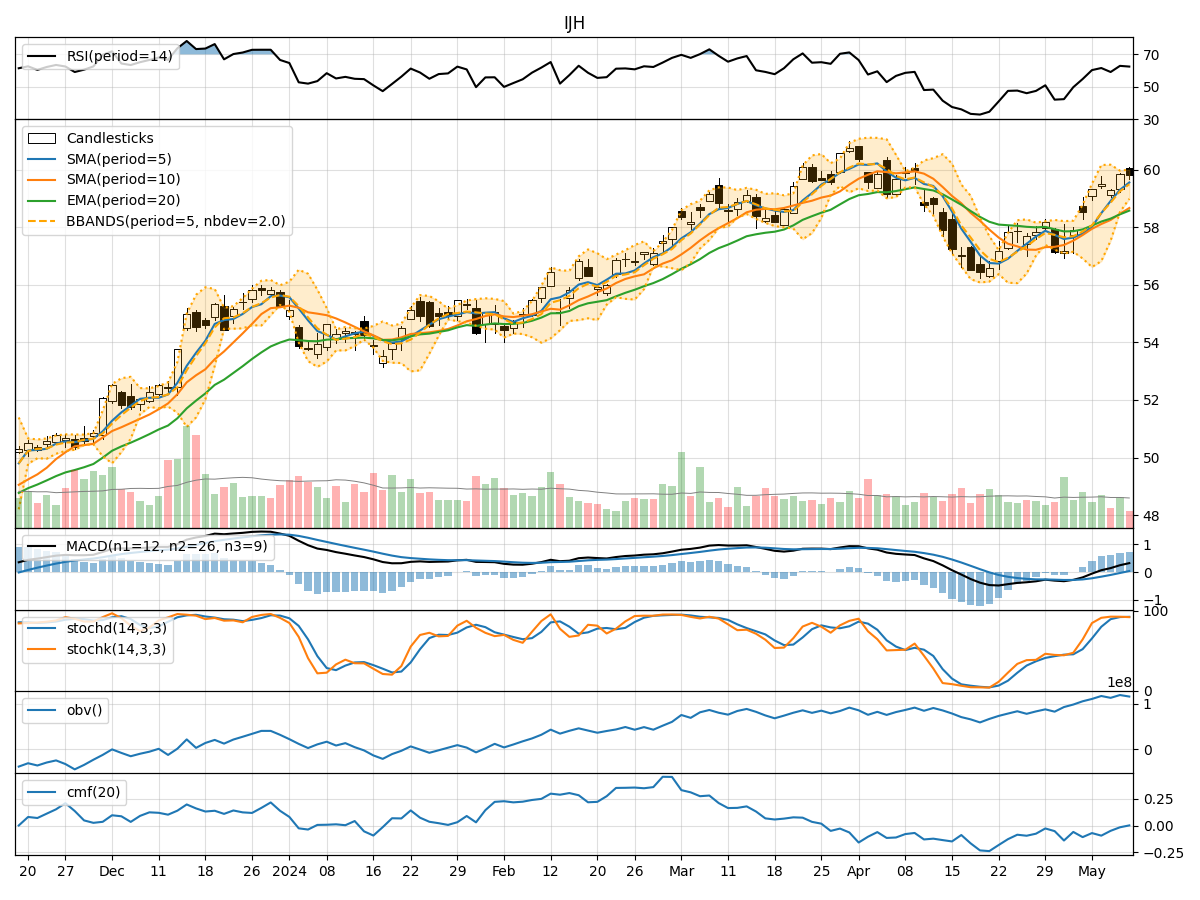
In the last 5 trading days, IJH has shown a mix of bullish and bearish signals across various technical indicators. The trend indicators suggest a slightly bullish sentiment, with the Moving Average Convergence Divergence (MACD) showing positive values. Momentum indicators indicate a strong bullish momentum, especially with the Relative Strength Index (RSI) consistently above 50. Volatility indicators show a narrowing Bollinger Bands (BB) width, indicating a potential decrease in volatility. Volume indicators, however, show a slightly negative Chaikin Money Flow (CMF) over the past 20 days.
Trend Indicators:
- Moving Averages (MA) are trending upwards, indicating a bullish sentiment.
- MACD is positive, suggesting a bullish trend.
- Exponential Moving Average (EMA) is also trending upwards, supporting the bullish outlook.
Momentum Indicators:
- RSI is consistently above 50, indicating a strong bullish momentum.
- Stochastic Oscillator shows overbought conditions but remains strong.
- Williams %R is in the oversold region, suggesting a potential reversal.
Volatility Indicators:
- Bollinger Bands are narrowing, indicating decreasing volatility.
- Bollinger Bands Percentage (BBP) is decreasing, suggesting a potential price breakout.
Volume Indicators:
- On-Balance Volume (OBV) has been relatively flat, indicating a lack of strong buying or selling pressure.
- Chaikin Money Flow (CMF) over the past 20 days is slightly negative, indicating a bearish sentiment.
Conclusion:
Based on the analysis of the technical indicators, the next few days for IJH are likely to see continued bullish momentum. The trend indicators, momentum indicators, and volatility indicators all point towards a potential upward movement in the stock price. Despite the slightly negative CMF, the overall picture is bullish.
Investors may consider buying or holding positions in IJH for potential gains in the short term. However, it is essential to monitor the indicators closely for any signs of reversal or weakening bullish momentum. As always, it is crucial to consider risk management strategies and stay informed about any external factors that may impact the stock market.