Technical Analysis of IJK 2024-05-10
Overview:
In analyzing the technical indicators for IJK stock over the last 5 days, we will delve into the trends, momentum, volatility, and volume indicators to provide a comprehensive outlook on the possible stock price movement in the coming days. By examining these key aspects, we aim to offer valuable insights and predictions for informed decision-making.
Trend Analysis:
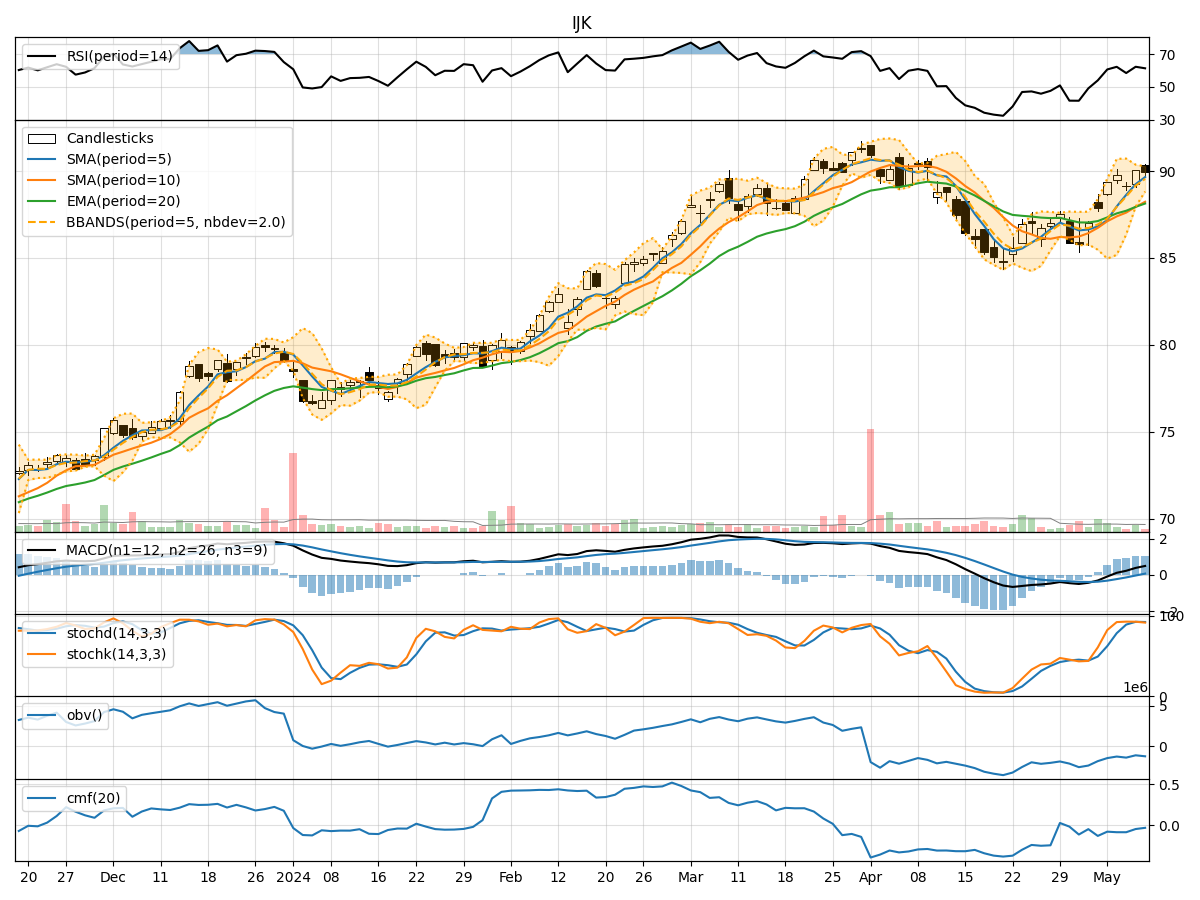
- Moving Averages (MA): The 5-day MA has been consistently above the closing prices, indicating a bullish trend.
- MACD: The MACD line has been consistently above the signal line, suggesting a bullish momentum.
- Relative Strength Index (RSI): The RSI values have been fluctuating around the overbought territory, indicating strong buying pressure.
Momentum Analysis:
- Stochastic Oscillator: Both %K and %D values have been in the overbought zone, signaling a potential reversal.
- Williams %R (WillR): The Williams %R values have been fluctuating, indicating a mixed sentiment among traders.
Volatility Analysis:
- Bollinger Bands (BB): The stock price has been trading within the bands, suggesting a period of consolidation.
- Bollinger %B (BBP): The %B values have been fluctuating around the midline, indicating uncertainty in price direction.
Volume Analysis:
- On-Balance Volume (OBV): The OBV values have been negative, suggesting distribution by investors.
- Chaikin Money Flow (CMF): The CMF values have been consistently negative, indicating selling pressure.
Key Observations:
- The trend indicators suggest a bullish sentiment in the short term.
- Momentum indicators show signs of potential overbought conditions.
- Volatility indicators point towards a period of consolidation.
- Volume indicators indicate selling pressure in the market.
Conclusion:
Based on the analysis of the technical indicators, the next few days for IJK stock may see a consolidation phase with a slight downward bias. Traders should exercise caution as the stock is likely to experience increased volatility due to conflicting signals from momentum and volume indicators. It is advisable to closely monitor key support and resistance levels for potential entry or exit points.
Recommendation:
- Short-term Traders: Consider taking profits on existing positions and wait for clearer signals before entering new trades.
- Long-term Investors: Monitor the stock closely for a potential entry point during the consolidation phase.
- Risk Management: Implement tight stop-loss orders to protect capital in case of unexpected price movements.
By combining insights from trend, momentum, volatility, and volume indicators, traders can make well-informed decisions to navigate the market dynamics effectively. Remember to stay updated on market news and events that may impact stock prices.