Technical Analysis of IJR 2024-05-10
Overview:
In analyzing the technical indicators for IJR over the last 5 days, we will delve into the trend, momentum, volatility, and volume indicators to provide a comprehensive outlook on the possible stock price movement. By examining these key aspects, we aim to offer valuable insights and predictions for the upcoming days.
Trend Indicators:
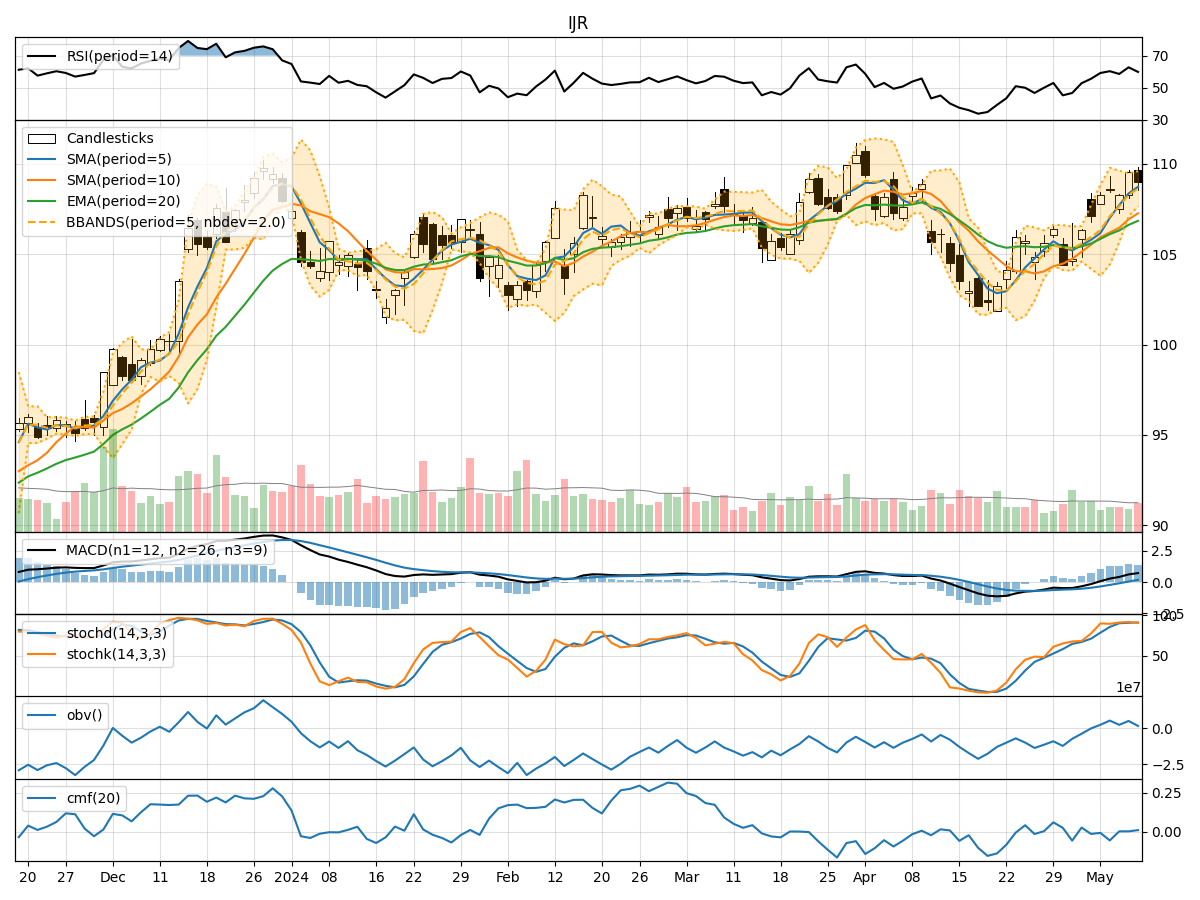
- Moving Averages (MA): The 5-day Moving Average has been consistently above the longer-term Simple Moving Average (SMA) and Exponential Moving Average (EMA), indicating a short-term bullish trend.
- MACD: The MACD line has been above the signal line for the past few days, suggesting positive momentum in the stock price.
- MACD Histogram: The MACD Histogram has shown an increasing trend, indicating strengthening bullish momentum.
Momentum Indicators:
- RSI: The Relative Strength Index (RSI) has been fluctuating around the 60-65 range, suggesting a neutral momentum in the stock.
- Stochastic Oscillator: Both %K and %D lines of the Stochastic Oscillator have been hovering in the overbought territory, indicating a potential reversal or consolidation phase.
- Williams %R: The Williams %R has been consistently in the oversold region, signaling a possible reversal in the stock price.
Volatility Indicators:
- Bollinger Bands: The Bollinger Bands have been narrowing, indicating decreasing volatility in the stock price.
- Bollinger %B: The %B indicator has been hovering around 0.6-0.8, suggesting the stock is trading closer to the upper band.
Volume Indicators:
- On-Balance Volume (OBV): The OBV has shown mixed signals with slight fluctuations, indicating indecision among investors.
- Chaikin Money Flow (CMF): The CMF has been close to zero, reflecting a balance between buying and selling pressure.
Key Observations and Opinions:
- Trend: The stock is currently in an upward trend based on moving averages and MACD analysis.
- Momentum: Momentum indicators suggest a neutral to slightly bearish bias due to overbought conditions in the Stochastic Oscillator.
- Volatility: Volatility has been decreasing, indicating a potential period of consolidation or sideways movement.
- Volume: Volume indicators show mixed signals, reflecting uncertainty among market participants.
Conclusion:
Based on the analysis of the technical indicators, the next few days for IJR could see sideways movement or a slight pullback in the stock price. Investors should closely monitor key support and resistance levels to gauge potential breakout or reversal points. It is advisable to wait for clearer signals from the indicators before making significant trading decisions.