Technical Analysis of IPO 2024-05-10
Overview:
In analyzing the provided IPO TA data for the last 5 days, we will delve into the technical indicators across trend, momentum, volatility, and volume to derive insights into the possible future stock price movement. By examining these indicators comprehensively, we aim to provide a well-structured and informed prediction for the upcoming days.
Trend Analysis:
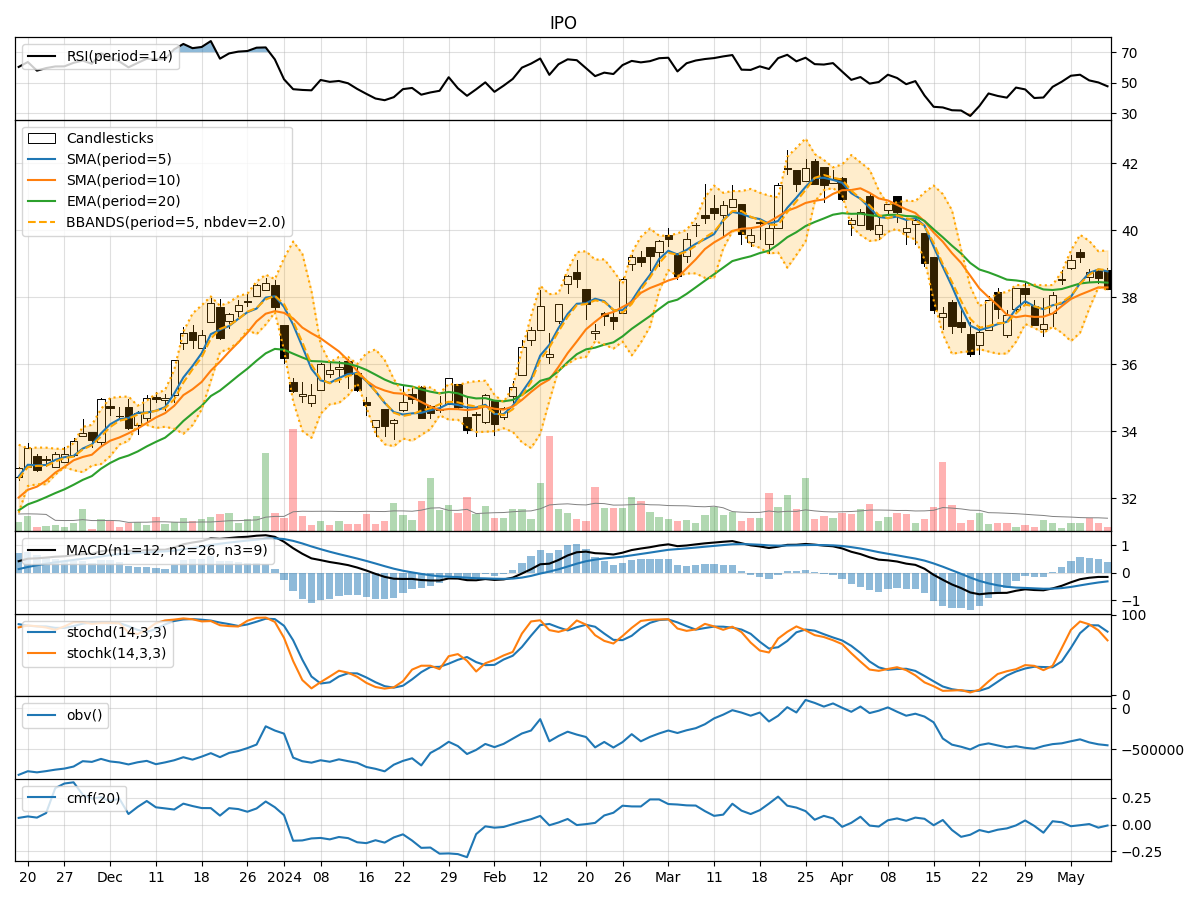
- Moving Averages (MA): The 5-day Moving Average (MA) has been fluctuating around the Simple Moving Average (SMA) and Exponential Moving Average (EMA) values, indicating a lack of clear trend direction.
- MACD: The Moving Average Convergence Divergence (MACD) has been negative, with the MACD line consistently below the signal line, suggesting a bearish momentum.
- Momentum: The MACD Histogram has been decreasing, indicating a weakening bearish momentum.
Momentum Analysis:
- RSI: The Relative Strength Index (RSI) has been declining, moving towards the oversold territory, signaling a potential reversal or consolidation.
- Stochastic Oscillator: Both %K and %D have been decreasing, with %K approaching oversold levels, indicating a bearish sentiment.
- Williams %R: The Williams %R has been consistently in the oversold region, suggesting a bearish outlook.
Volatility Analysis:
- Bollinger Bands (BB): The stock price has been trading within the Bollinger Bands, with the bands narrowing, indicating decreasing volatility.
- Bollinger Band %B: The %B indicator has been relatively low, suggesting a potential consolidation phase.
Volume Analysis:
- On-Balance Volume (OBV): The OBV has been negative, indicating distribution and selling pressure in the stock.
- Chaikin Money Flow (CMF): The CMF has been negative, reflecting a bearish money flow trend.
Key Observations:
- The stock is currently in a bearish phase, as indicated by the negative MACD, declining RSI, and oversold Stochastic and Williams %R.
- Volatility has been decreasing, potentially leading to a period of consolidation.
- The negative OBV and CMF suggest a bearish sentiment among investors.
Conclusion:
Based on the analysis of the technical indicators, the outlook for the next few days is bearish. The stock is likely to experience further downward pressure, with a potential for consolidation as volatility decreases. Traders and investors should exercise caution and consider waiting for more definitive signals of a trend reversal before considering long positions.