Technical Analysis of IQHI 2024-05-10
Overview:
In analyzing the technical indicators for IQHI over the last 5 days, we will delve into the trend, momentum, volatility, and volume indicators to provide a comprehensive outlook on the possible stock price movement in the coming days. By examining these key indicators, we aim to offer valuable insights and predictions for informed decision-making.
Trend Indicators:
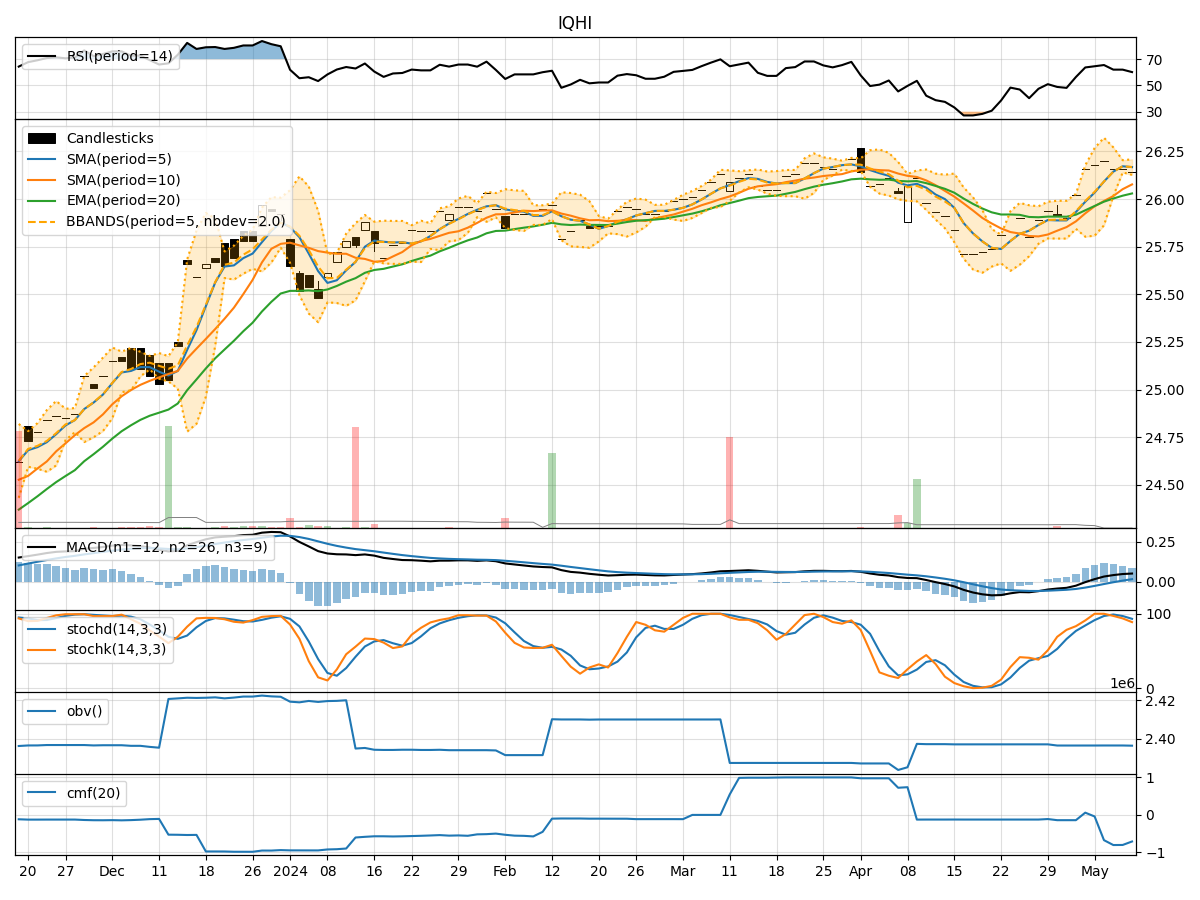
- Moving Averages (MA): The 5-day MA has been consistently above the closing prices, indicating a bullish trend.
- MACD: The MACD line has been positive and above the signal line, suggesting bullish momentum.
- EMA: The EMA has been trending upwards, supporting the bullish sentiment.
Momentum Indicators:
- RSI: The RSI has been in the neutral zone, indicating neither overbought nor oversold conditions.
- Stochastic Oscillator: Both %K and %D have been declining, signaling a potential reversal in momentum.
- Williams %R: The indicator has been in the oversold territory, suggesting a possible buying opportunity.
Volatility Indicators:
- Bollinger Bands (BB): The stock price has been trading within the bands, indicating a period of consolidation.
- BB Width: The bands have been narrowing, suggesting decreasing volatility.
- BB %B: The %B indicator has been hovering around the middle, reflecting a balanced market sentiment.
Volume Indicators:
- On-Balance Volume (OBV): The OBV has been relatively flat, indicating a lack of significant buying or selling pressure.
- Chaikin Money Flow (CMF): The CMF has been negative, suggesting outflow of money from the stock.
Key Observations:
- The trend indicators point towards a bullish sentiment with positive moving averages and MACD.
- Momentum indicators show a potential reversal in momentum with stochastic oscillator signaling oversold conditions.
- Volatility indicators indicate a period of consolidation with decreasing volatility.
- Volume indicators suggest a lack of significant buying pressure and negative money flow.
Conclusion:
Based on the analysis of the technical indicators, the stock price of IQHI is likely to experience a short-term consolidation phase with a potential bullish bias in the coming days. Traders may consider buying opportunities when the price reaches oversold levels as indicated by the momentum indicators. However, it is essential to monitor the price action closely for any signs of a breakout or trend reversal.