Technical Analysis of IVOL 2024-05-10
Overview:
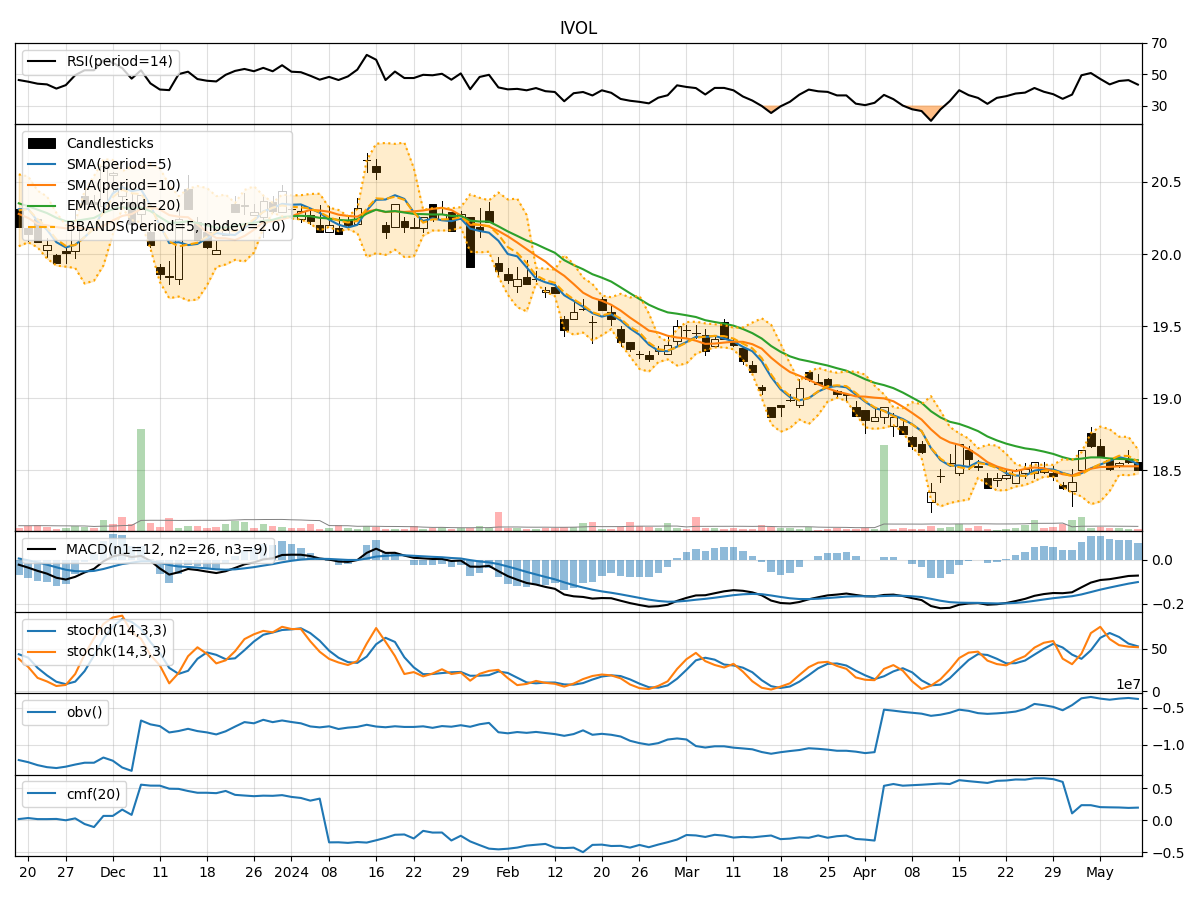
In the last 5 trading days, the stock has shown a relatively stable price movement with minor fluctuations. The trend indicators suggest a slightly bearish sentiment, while momentum indicators show a neutral to slightly bearish outlook. Volatility indicators indicate a decreasing trend in volatility, and volume indicators show a mixed sentiment.
Trend Analysis:
- Moving Averages (MA): The 5-day Moving Average (MA) is slightly below the Simple Moving Average (SMA) and Exponential Moving Average (EMA), indicating a short-term bearish trend.
- MACD: The MACD line is below the signal line, suggesting a bearish momentum in the stock price.
- MACD Histogram: The MACD Histogram is decreasing, indicating a weakening bearish momentum.
Momentum Analysis:
- RSI: The Relative Strength Index (RSI) is below 50, indicating a neutral to slightly bearish momentum.
- Stochastic Oscillator: Both %K and %D are below 50, suggesting a bearish sentiment.
- Williams %R: The Williams %R is in the oversold territory, indicating a potential reversal or continuation of the bearish trend.
Volatility Analysis:
- Bollinger Bands (BB): The Bollinger Bands are narrowing, indicating decreasing volatility in the stock price.
- Bollinger %B: The %B is below 0.5, suggesting a potential oversold condition.
Volume Analysis:
- On-Balance Volume (OBV): The OBV is showing a mixed trend, indicating indecision among investors.
- Chaikin Money Flow (CMF): The CMF is slightly positive, suggesting some buying pressure.
Key Observations:
- The trend indicators point towards a bearish sentiment in the short term.
- Momentum indicators show a neutral to slightly bearish outlook.
- Volatility is decreasing, indicating a potential consolidation phase.
- Volume indicators are mixed, reflecting uncertainty among market participants.
Conclusion:
Based on the analysis of technical indicators, the next few days' possible stock price movement is likely to be sideways or in a consolidation phase. The bearish trend indicated by the trend and momentum indicators may lead to some downward pressure, but the decreasing volatility and mixed volume signals suggest a lack of strong conviction in either direction. Traders should exercise caution and wait for clearer signals before making significant trading decisions.