Technical Analysis of IVV 2024-05-03
Overview:
In analyzing the technical indicators for IVV over the last 5 days, we will delve into the trend, momentum, volatility, and volume indicators to provide a comprehensive outlook on the possible stock price movement in the coming days. By examining these key aspects, we aim to offer valuable insights and predictions for informed decision-making.
Trend Analysis:
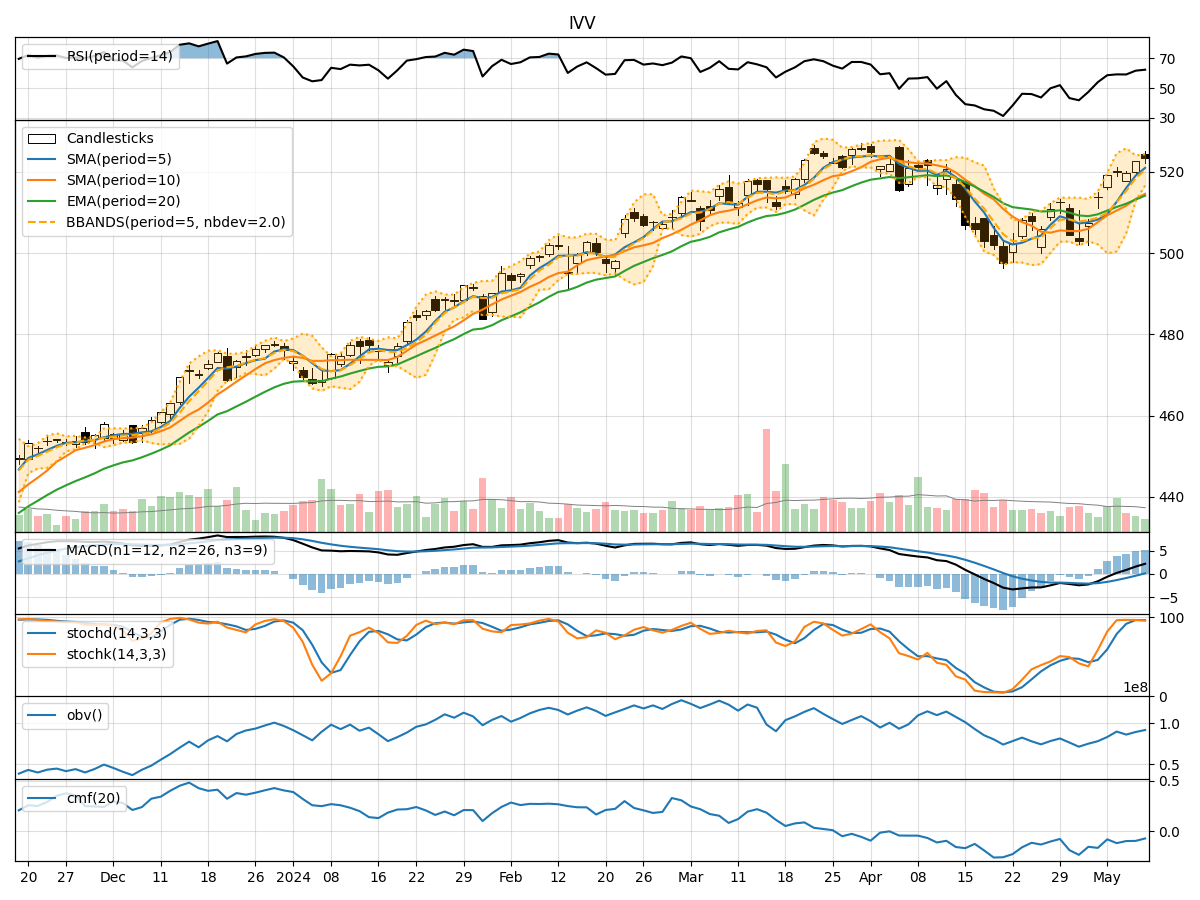
- Moving Averages (MA): The 5-day Moving Average (MA) has been fluctuating around the Simple Moving Average (SMA) and Exponential Moving Average (EMA) values, indicating a lack of clear trend direction.
- MACD: The Moving Average Convergence Divergence (MACD) has been negative, with the MACD line consistently below the signal line, suggesting a bearish momentum in the short term.
Momentum Analysis:
- RSI: The Relative Strength Index (RSI) has been hovering around the 50 level, indicating a neutral momentum with no clear overbought or oversold conditions.
- Stochastic Oscillator: Both %K and %D values have been fluctuating, showing indecision in momentum direction.
- Williams %R: The Williams %R is also neutral, not providing a strong indication of potential price movement.
Volatility Analysis:
- Bollinger Bands: The Bollinger Bands have been relatively narrow, indicating low volatility in the stock price movement.
- Bollinger %B: The %B value has been close to 0.5, suggesting the price is trading around the middle band with no extreme movements.
Volume Analysis:
- On-Balance Volume (OBV): The OBV has been negative, indicating selling pressure in the stock.
- Chaikin Money Flow (CMF): The CMF has been consistently negative, reflecting a lack of buying interest in the stock.
Key Observations:
- The trend indicators show a lack of clear direction, with a slightly bearish bias indicated by the MACD.
- Momentum indicators suggest a neutral stance with no strong signals for either bullish or bearish momentum.
- Volatility remains low, indicating a stable price movement with no significant fluctuations.
- Volume indicators point towards selling pressure and a lack of buying interest in the stock.
Conclusion:
Based on the analysis of the technical indicators, the stock price of IVV is likely to continue trading sideways with a slight bearish bias in the coming days. The lack of strong trends, coupled with neutral momentum and low volatility, suggests a period of consolidation or range-bound trading. Investors should exercise caution and closely monitor any developments in the market that could potentially shift the current dynamics.