Technical Analysis of IXC 2024-05-10
Overview:
In analyzing the technical indicators for IXC over the last 5 days, we will delve into the trend, momentum, volatility, and volume indicators to provide a comprehensive outlook on the possible stock price movement. By examining these key aspects, we aim to offer valuable insights and predictions for the upcoming days.
Trend Analysis:
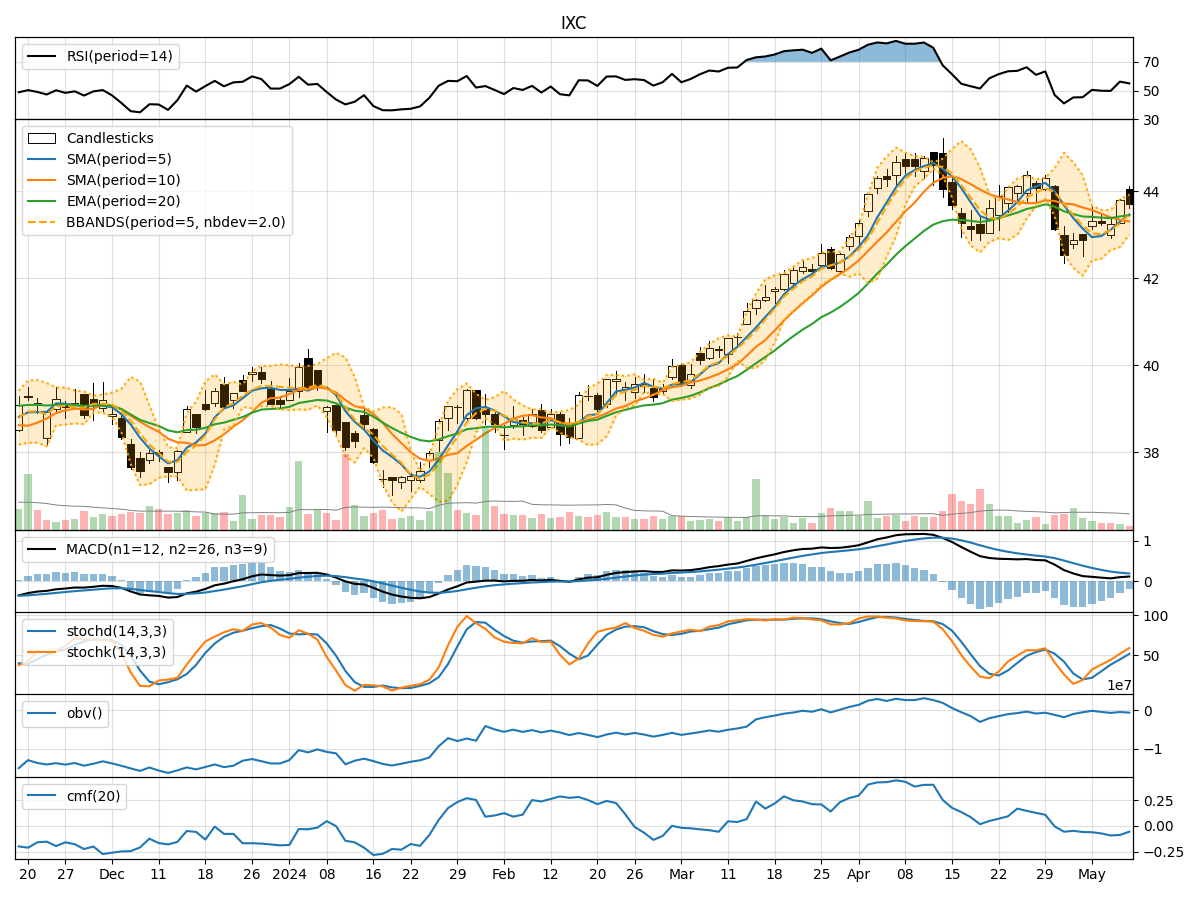
- Moving Averages (MA): The 5-day Moving Average (MA) has been fluctuating around the closing prices, indicating short-term price trends. The Simple Moving Average (SMA) and Exponential Moving Average (EMA) show a slight downward trend, with the EMA slightly below the SMA.
- MACD: The Moving Average Convergence Divergence (MACD) and its signal line have been converging, suggesting a potential reversal in the short-term trend.
- Conclusion: The trend indicators point towards a sideways movement in the stock price in the near future.
Momentum Analysis:
- RSI: The Relative Strength Index (RSI) has been hovering around the neutral zone, indicating a balanced momentum between buying and selling pressure.
- Stochastic Oscillator: Both %K and %D lines of the Stochastic Oscillator are in the overbought territory, suggesting a potential reversal or consolidation.
- Conclusion: The momentum indicators suggest a potential consolidation or reversal in the stock price movement.
Volatility Analysis:
- Bollinger Bands (BB): The Bollinger Bands are narrowing, indicating decreasing volatility in the stock price.
- Conclusion: The volatility indicators signal a decrease in volatility, which could lead to a period of consolidation or range-bound trading.
Volume Analysis:
- On-Balance Volume (OBV): The OBV has been fluctuating, indicating a balance between buying and selling pressure.
- Chaikin Money Flow (CMF): The CMF is negative, suggesting a slight outflow of money from the stock.
- Conclusion: The volume indicators imply a neutral sentiment in terms of volume flow.
Overall Conclusion:
Based on the analysis of trend, momentum, volatility, and volume indicators, the next few days for IXC are likely to see a sideways movement with potential consolidation. The stock price may trade within a narrow range as volatility decreases, and momentum shows signs of reversal or consolidation. Traders and investors should closely monitor key support and resistance levels for potential breakout opportunities.
Key Recommendations:
- Monitor Support and Resistance Levels: Keep a close eye on key support and resistance levels to identify potential breakout or breakdown points.
- Use Stop-Loss Orders: Implement stop-loss orders to manage risk in case of unexpected price movements.
- Stay Informed: Stay updated on market news and events that could impact the stock price of IXC.
- Consider Diversification: Diversify your portfolio to mitigate risks associated with individual stock movements.
By considering these recommendations and staying vigilant of the technical indicators, traders and investors can make informed decisions regarding their positions in IXC.