Technical Analysis of JHCB 2024-05-10
Overview:
In analyzing the technical indicators for JHCB stock over the last 5 days, we will delve into the trend, momentum, volatility, and volume indicators to provide a comprehensive outlook on the possible future stock price movement. By examining these key indicators, we aim to offer valuable insights and predictions for the upcoming trading days.
Trend Analysis:
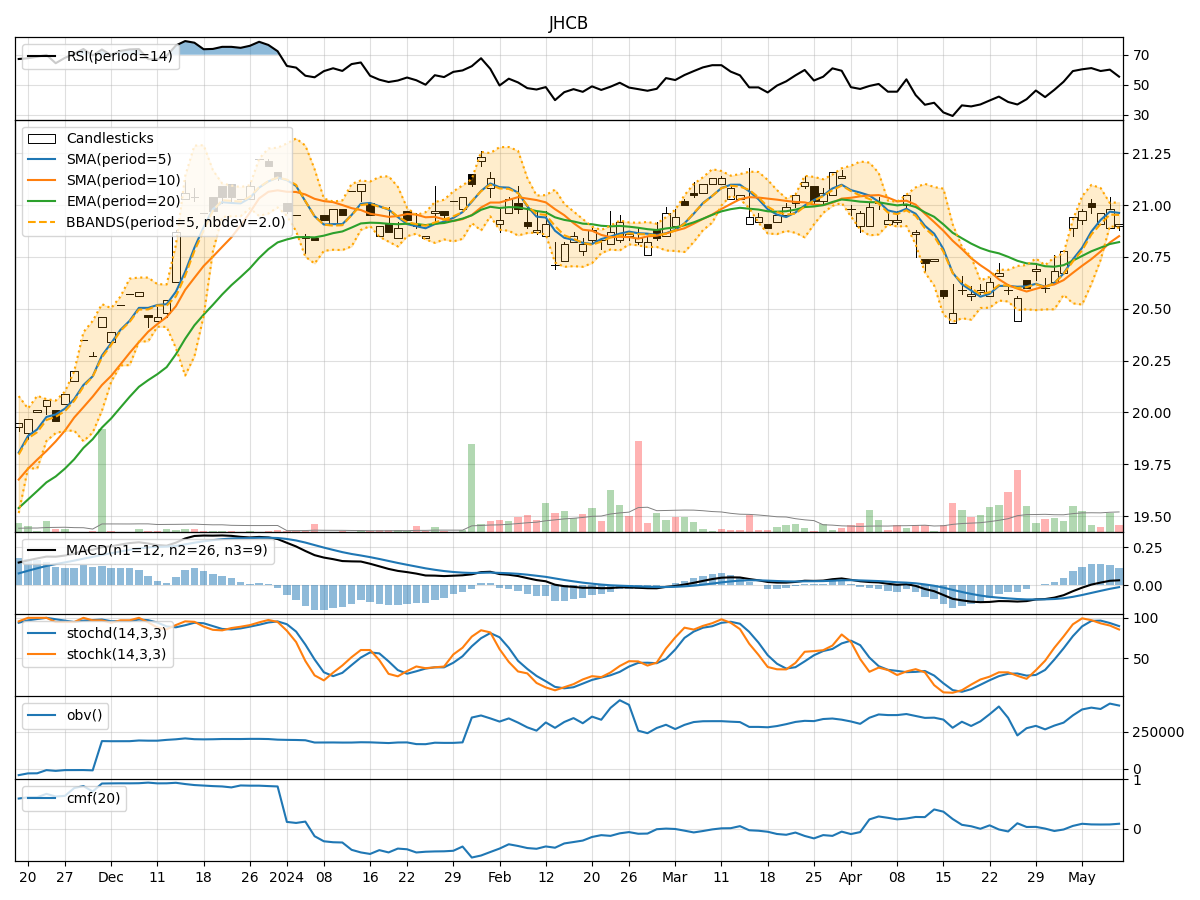
- Moving Averages (MA): The 5-day MA has been consistently above the closing prices, indicating a short-term uptrend.
- MACD: The MACD line has been above the signal line, suggesting bullish momentum.
- RSI: The RSI has been fluctuating around the 50 level, indicating a neutral stance.
Key Observation: The trend indicators suggest a bullish sentiment in the short term.
Momentum Analysis:
- Stochastic Oscillator: Both %K and %D have been declining but remain in the overbought territory.
- Williams %R: The indicator has been moving lower into oversold levels.
Key Observation: Momentum indicators show a potential for a short-term pullback or consolidation.
Volatility Analysis:
- Bollinger Bands (BB): The stock price has been trading within the bands, with the bands narrowing, indicating reduced volatility.
- Bollinger %B: The %B is close to 0, suggesting the stock is trading near the lower band.
Key Observation: Volatility indicators point towards a period of consolidation or a potential breakout.
Volume Analysis:
- On-Balance Volume (OBV): The OBV has been fluctuating but showing a slight increase, indicating some buying pressure.
- Chaikin Money Flow (CMF): The CMF has been positive, reflecting accumulation.
Key Observation: Volume indicators suggest a mixed sentiment with a slight bullish bias.
Conclusion:
Based on the analysis of the technical indicators, the next few days' possible stock price movement for JHCB is likely to see sideways consolidation with a slight bullish bias. Traders should watch for a potential breakout if the stock price breaches the upper Bollinger Band, while also being cautious of a short-term pullback given the overbought conditions in the momentum indicators. Overall, a balanced approach with a focus on key support and resistance levels is recommended for trading or investment decisions in the coming days.