Technical Analysis of JHMB 2024-05-10
Overview:
In analyzing the technical indicators for JHMB stock over the last 5 days, we will delve into the trend, momentum, volatility, and volume indicators to provide a comprehensive outlook on the possible stock price movement in the coming days. By examining these key indicators, we aim to offer valuable insights and predictions for potential investors.
Trend Analysis:
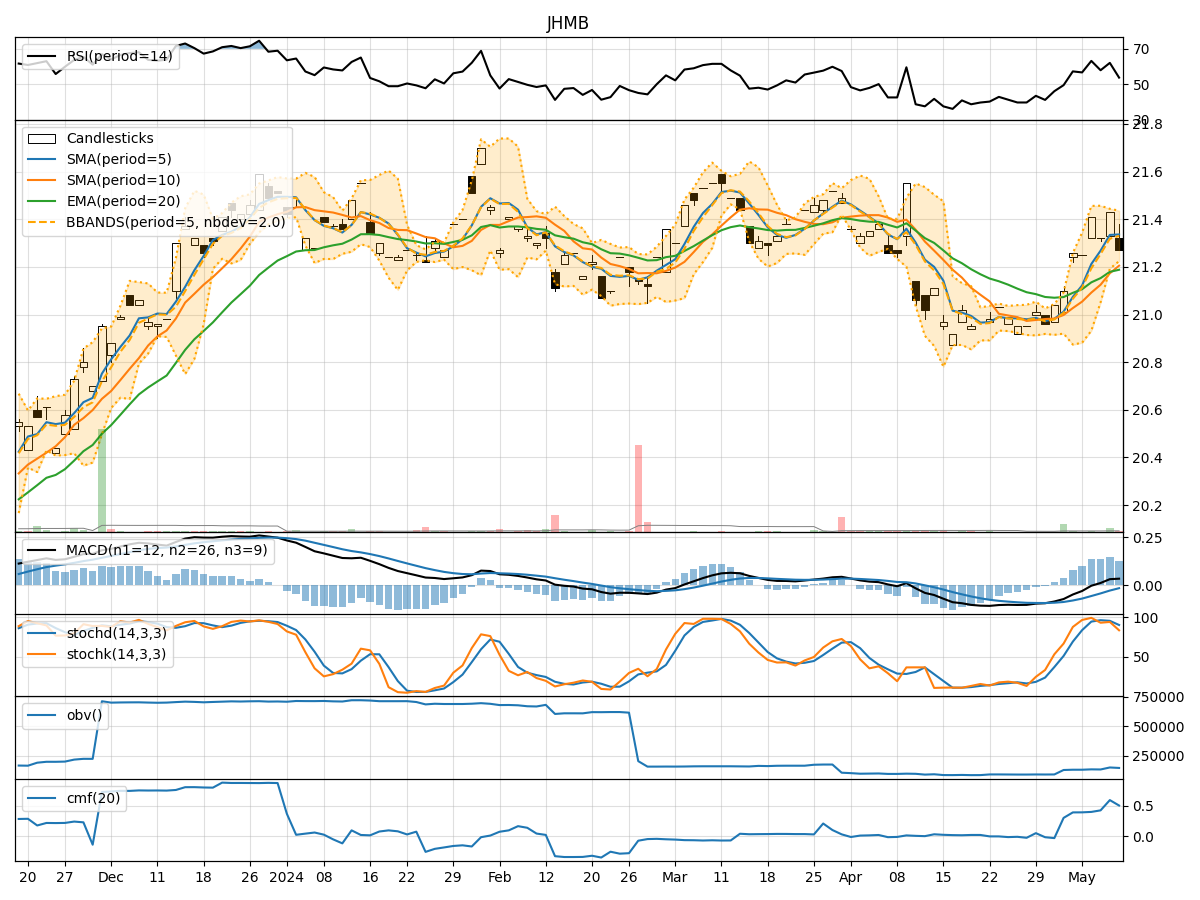
- Moving Averages (MA): The 5-day Moving Average (MA) has been consistently above the Simple Moving Average (SMA) and Exponential Moving Average (EMA), indicating a short-term bullish trend.
- MACD: The MACD line has been consistently above the signal line, with both lines showing an upward trend, suggesting bullish momentum.
- Conclusion: The trend indicators point towards an upward trend in the stock price.
Momentum Analysis:
- RSI: The Relative Strength Index (RSI) has been fluctuating but generally staying within the neutral range, indicating a balanced momentum.
- Stochastic Oscillator: Both %K and %D have been fluctuating, but %K has shown a slight decline, suggesting a potential weakening of momentum.
- Conclusion: The momentum indicators suggest a neutral to slightly bearish momentum in the stock.
Volatility Analysis:
- Bollinger Bands (BB): The stock price has been trading within the Bollinger Bands, with the bands narrowing, indicating decreasing volatility.
- Conclusion: The volatility indicators signal a decreasing volatility in the stock price.
Volume Analysis:
- On-Balance Volume (OBV): The OBV has been fluctuating but has not shown a clear trend, indicating mixed volume flow.
- Chaikin Money Flow (CMF): The CMF has been positive, suggesting buying pressure in the stock.
- Conclusion: The volume indicators reflect mixed volume activity in the stock.
Overall Conclusion:
Based on the analysis of the technical indicators: - Trend: The trend indicators suggest an upward trend in the stock price. - Momentum: The momentum indicators indicate a neutral to slightly bearish momentum. - Volatility: The volatility indicators point towards decreasing volatility. - Volume: The volume indicators show mixed volume activity.
Final Verdict:
Considering the overall analysis, the stock of JHMB is likely to experience upward movement in the coming days, supported by the bullish trend and decreasing volatility. However, the slightly bearish momentum and mixed volume activity may introduce some uncertainty. Investors should closely monitor the stock's price action and key technical levels to make informed decisions.
Disclaimer:
This analysis is based solely on technical indicators and historical data, and it is essential to consider other fundamental factors and market dynamics before making investment decisions. Consulting with a financial advisor for personalized guidance is recommended.