Technical Analysis of JNK 2024-05-10
Overview:
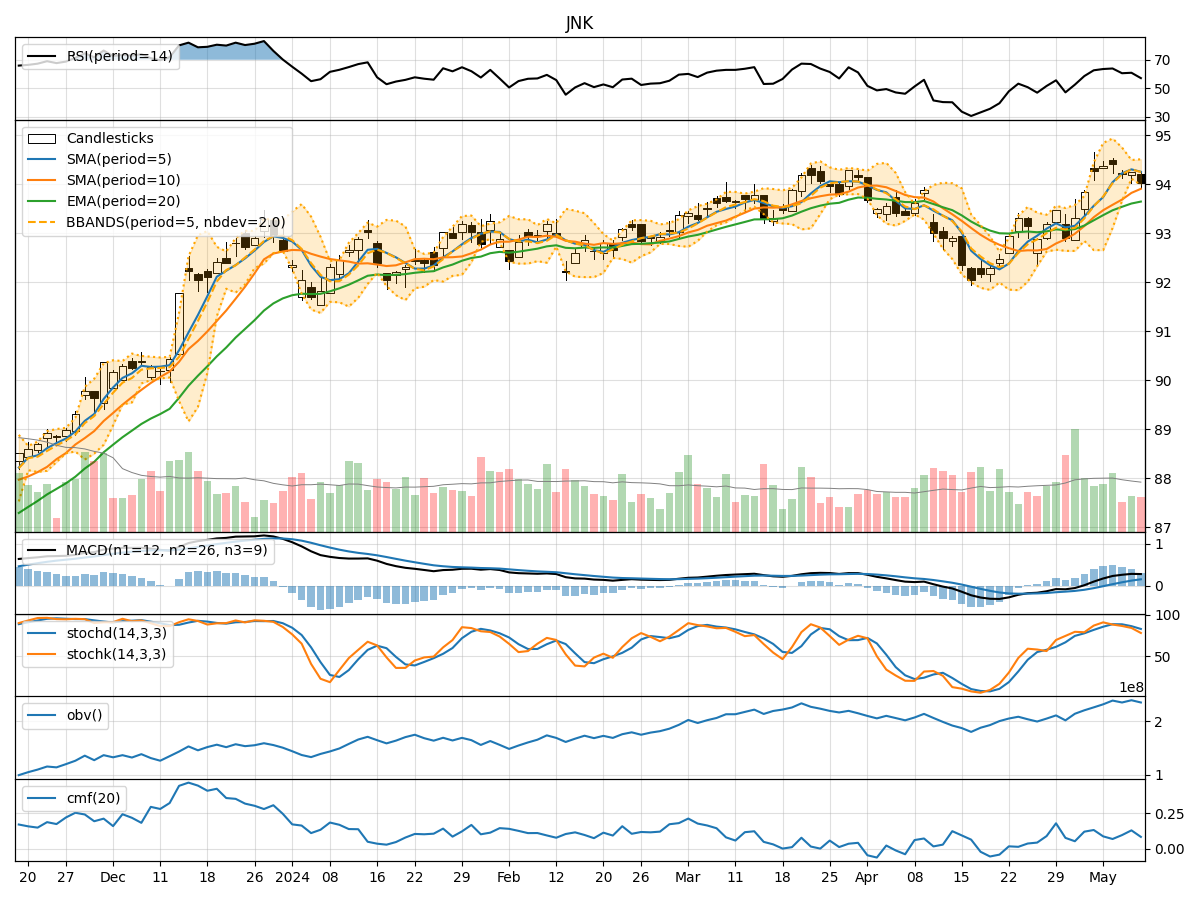
In analyzing the technical indicators for JNK over the last 5 days, we will delve into the trend, momentum, volatility, and volume indicators to provide a comprehensive outlook on the possible stock price movement in the coming days.
Trend Analysis:
- Moving Averages (MA): The 5-day Moving Average (MA) has been consistently above the Simple Moving Average (SMA) and Exponential Moving Average (EMA), indicating a bullish trend.
- MACD: The MACD line has been consistently above the signal line, with both lines showing an upward trend, suggesting bullish momentum.
- Conclusion: The trend indicators point towards an upward trend in the stock price.
Momentum Analysis:
- RSI: The Relative Strength Index (RSI) has been fluctuating around the 60-70 range, indicating a neutral momentum.
- Stochastic Oscillator: Both %K and %D have been gradually decreasing, moving towards the oversold territory.
- Conclusion: The momentum indicators suggest a neutral to slightly bearish momentum in the stock.
Volatility Analysis:
- Bollinger Bands (BB): The stock price has been trading within the Bollinger Bands, with the bands narrowing, indicating decreasing volatility.
- Conclusion: Volatility indicators signal a decreasing volatility in the stock price.
Volume Analysis:
- On-Balance Volume (OBV): The OBV has been fluctuating but showing a slight increase over the last few days, indicating buying pressure.
- Chaikin Money Flow (CMF): The CMF has been positive, suggesting money flow into the stock.
- Conclusion: Volume indicators point towards positive volume flow in the stock.
Conclusion:
Based on the analysis of trend, momentum, volatility, and volume indicators, the overall outlook for JNK in the next few days is as follows: - Trend: The trend indicators suggest an upward trend in the stock price. - Momentum: The momentum indicators indicate a neutral to slightly bearish momentum. - Volatility: Volatility indicators signal a decreasing volatility. - Volume: Volume indicators point towards positive volume flow.
Final Recommendation:
Considering the overall analysis, while the trend is bullish, the neutral to slightly bearish momentum and decreasing volatility may lead to some consolidation or minor pullback in the stock price in the coming days. Investors should monitor the stock closely for potential entry or exit points, keeping in mind the current market dynamics and risk tolerance levels.