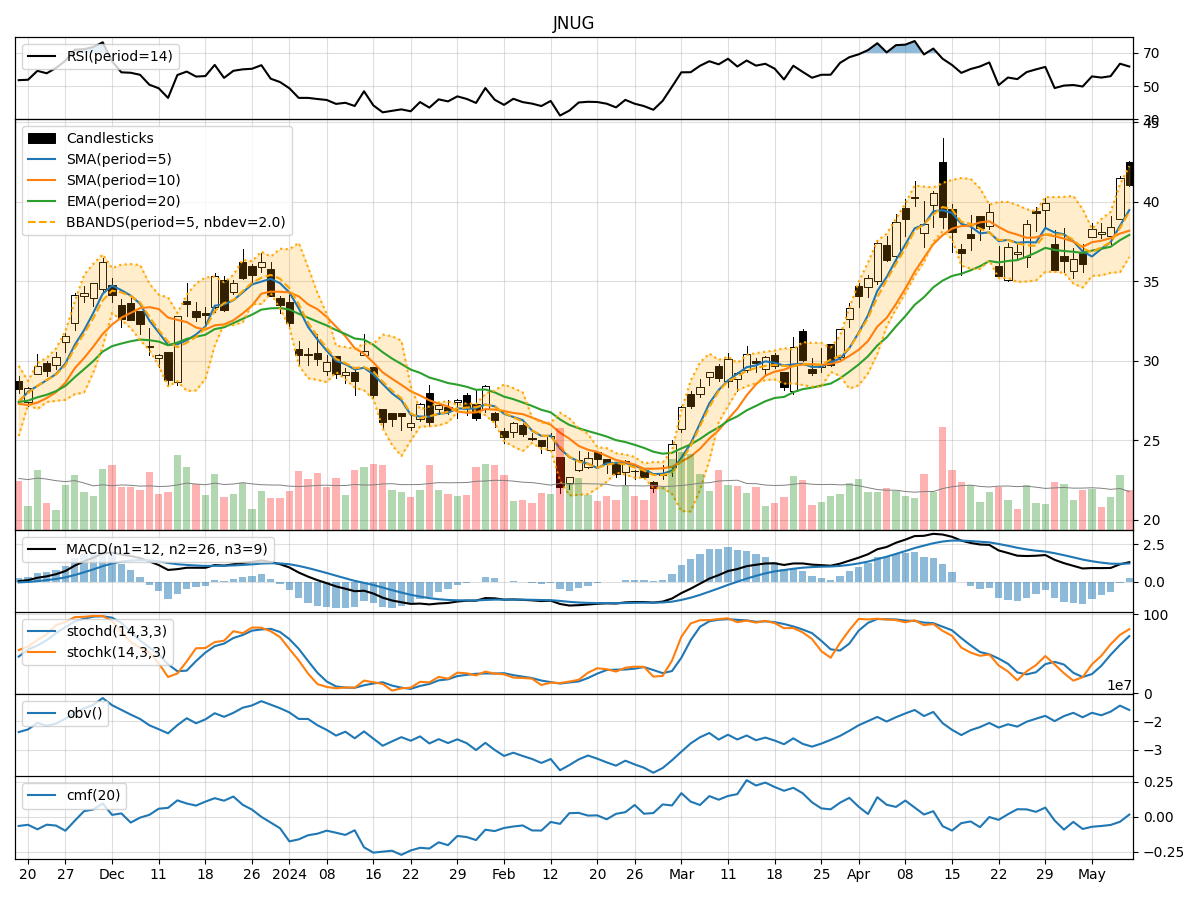
Technical Analysis of JNUG 2024-05-10
Overview:
In analyzing the technical indicators for JNUG over the last 5 days, we will delve into the trend, momentum, volatility, and volume indicators to provide a comprehensive outlook on the possible stock price movement in the coming days. By examining these key aspects, we aim to offer valuable insights and predictions for informed decision-making.
Trend Analysis:
- Moving Averages (MA): The 5-day Moving Average (MA) has been showing an upward trend, indicating a positive momentum in the stock price.
- MACD: The Moving Average Convergence Divergence (MACD) has been consistently positive, suggesting bullish momentum in the stock.
- EMA: The Exponential Moving Average (EMA) has been trending upwards, supporting the bullish sentiment in the stock.
Momentum Analysis:
- RSI: The Relative Strength Index (RSI) has been in the overbought territory, indicating a strong bullish momentum.
- Stochastic Oscillator: Both %K and %D values have been in the overbought zone, signaling a potential reversal or consolidation.
- Williams %R: The Williams %R is also in the overbought region, suggesting a possible pullback in the stock price.
Volatility Analysis:
- Bollinger Bands: The Bollinger Bands are widening, indicating increased volatility in the stock price.
- Bollinger %B: The %B value is relatively high, suggesting that the stock price is trading towards the upper band, potentially indicating an overbought condition.
Volume Analysis:
- On-Balance Volume (OBV): The OBV has been showing a mixed trend, with some days experiencing higher volume accumulation and others showing distribution.
- Chaikin Money Flow (CMF): The CMF has been negative, indicating potential selling pressure in the stock.
Conclusion:
Based on the analysis of the technical indicators, the stock of JNUG is currently exhibiting strong bullish momentum supported by the moving averages and MACD. However, the overbought conditions indicated by RSI, Stochastic Oscillator, and Williams %R suggest a potential short-term pullback or consolidation in the stock price. The widening Bollinger Bands and high %B value also point towards increased volatility and a possible correction.
Therefore, the next few days may see a temporary reversal or consolidation in the stock price of JNUG before potentially resuming its upward trend. Traders and investors should closely monitor the key indicators mentioned above to navigate the market dynamics effectively and make well-informed decisions.