Technical Analysis of JPMB 2024-05-10
Overview:
In analyzing the technical indicators for JPMB stock over the last 5 days, we will delve into the trend, momentum, volatility, and volume indicators to provide a comprehensive outlook on the possible stock price movement in the coming days. By examining these key indicators, we aim to offer valuable insights and predictions for potential investors.
Trend Analysis:
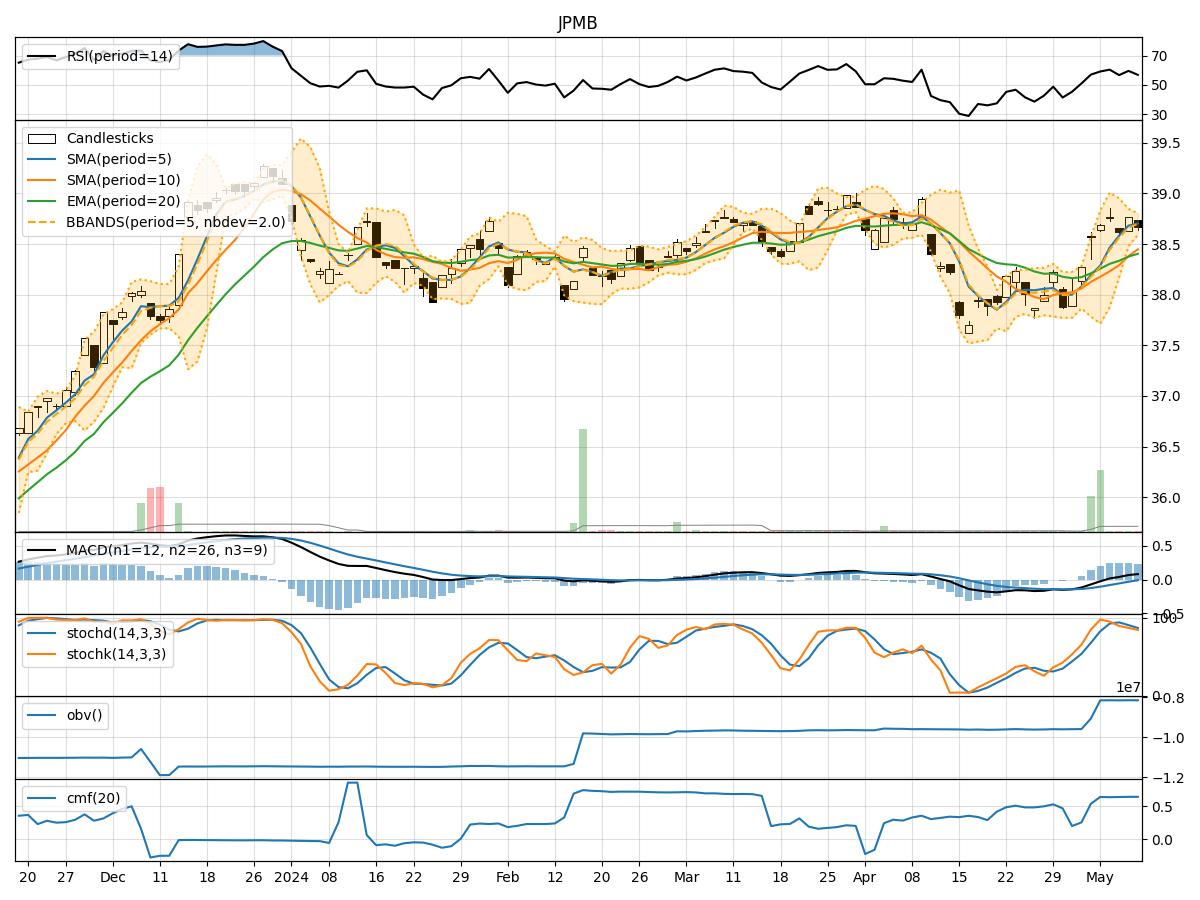
- Moving Averages (MA): The 5-day Moving Average (MA) has been consistently above the Simple Moving Average (SMA) and Exponential Moving Average (EMA), indicating a bullish trend.
- MACD: The MACD line has been consistently above the signal line, with both lines showing an upward trend, suggesting bullish momentum.
- MACD Histogram: The MACD Histogram has been consistently above the zero line, indicating increasing bullish momentum.
Momentum Analysis:
- RSI: The Relative Strength Index (RSI) has been fluctuating around the 50 level, indicating a neutral momentum.
- Stochastic Oscillator: Both %K and %D lines of the Stochastic Oscillator have been trending downwards, suggesting a potential reversal in momentum.
- Williams %R: The Williams %R indicator has been hovering in the oversold territory, indicating a potential buying opportunity.
Volatility Analysis:
- Bollinger Bands (BB): The stock price has been trading within the Bollinger Bands, with the bands narrowing, indicating decreasing volatility.
- Bollinger %B: The %B indicator has been fluctuating around the 0.5 level, suggesting a balanced market sentiment.
Volume Analysis:
- On-Balance Volume (OBV): The OBV indicator has been relatively stable, indicating consistent buying pressure.
- Chaikin Money Flow (CMF): The CMF indicator has been trending slightly upwards, suggesting a potential inflow of money into the stock.
Key Observations:
- The trend indicators suggest a strong bullish sentiment in the short term.
- Momentum indicators show a neutral to slightly bearish momentum.
- Volatility indicators point towards decreasing volatility in the stock.
- Volume indicators indicate consistent buying pressure in the stock.
Conclusion:
Based on the analysis of the technical indicators, the next few days' possible stock price movement for JPMB is likely to be upward in the short term. The bullish trend indicated by the moving averages and MACD, coupled with stable volume indicators, suggests a positive outlook for the stock. However, investors should closely monitor the momentum indicators for any potential reversal in momentum. Overall, the stock is expected to experience an upward movement in the coming days.