Technical Analysis of KEM 2024-05-31
Overview:
In analyzing the technical indicators for KEM over the last 5 days, we will delve into the trend, momentum, volatility, and volume indicators to provide a comprehensive outlook on the possible stock price movement in the coming days. By examining these key aspects, we aim to offer valuable insights and predictions to guide your investment decisions.
Trend Indicators:
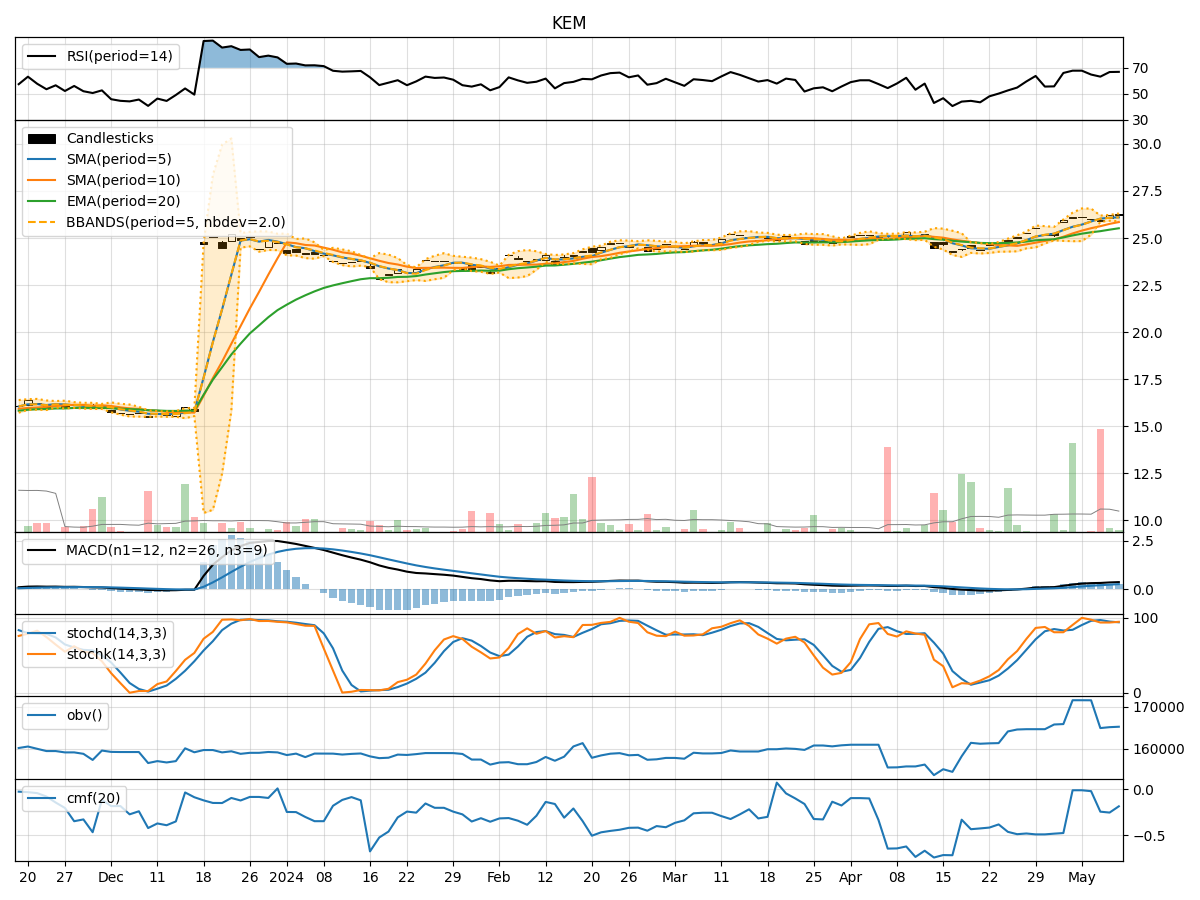
- Moving Averages (MA): The 5-day MA has been consistently decreasing, indicating a short-term downtrend in the stock price.
- MACD: The MACD line has been declining, with the MACD histogram showing negative values, suggesting a bearish momentum.
- EMA: The EMA has also been trending downwards, further supporting the bearish sentiment in the short to medium term.
Momentum Indicators:
- RSI: The RSI has been decreasing, indicating a weakening momentum in the stock price movement.
- Stochastic Oscillator: Both %K and %D have been declining, signaling a bearish momentum.
- Williams %R: The indicator has been in the oversold territory, suggesting a potential reversal or continuation of the downtrend.
Volatility Indicators:
- Bollinger Bands: The bands have been narrowing, indicating decreasing volatility in the stock price.
- Bollinger %B: The %B indicator has been hovering around 0.1, suggesting the stock is trading near the lower band.
Volume Indicators:
- On-Balance Volume (OBV): The OBV has been relatively stable, indicating no significant divergence between volume and price movement.
- Chaikin Money Flow (CMF): The CMF has been slightly negative, reflecting some selling pressure in the stock.
Key Observations and Opinions:
- Trend: The trend indicators point towards a bearish sentiment in the stock price, supported by the declining moving averages and MACD.
- Momentum: The momentum indicators also align with the bearish outlook, with RSI and Stochastic Oscillator showing weakening momentum.
- Volatility: The decreasing volatility, as indicated by the Bollinger Bands, suggests a potential period of consolidation or a lack of significant price movements.
- Volume: The volume indicators do not show any strong divergence, indicating that the recent price movements are in line with the trading volume.
Conclusion:
Based on the analysis of the technical indicators, the next few days for KEM stock are likely to see further downward movement. The bearish trend and momentum, coupled with low volatility and stable volume, suggest that the stock may continue its current downtrend. Investors should exercise caution and consider potential short-selling or wait for a clear reversal signal before considering long positions.