Technical Analysis of KIE 2024-05-10
Overview:
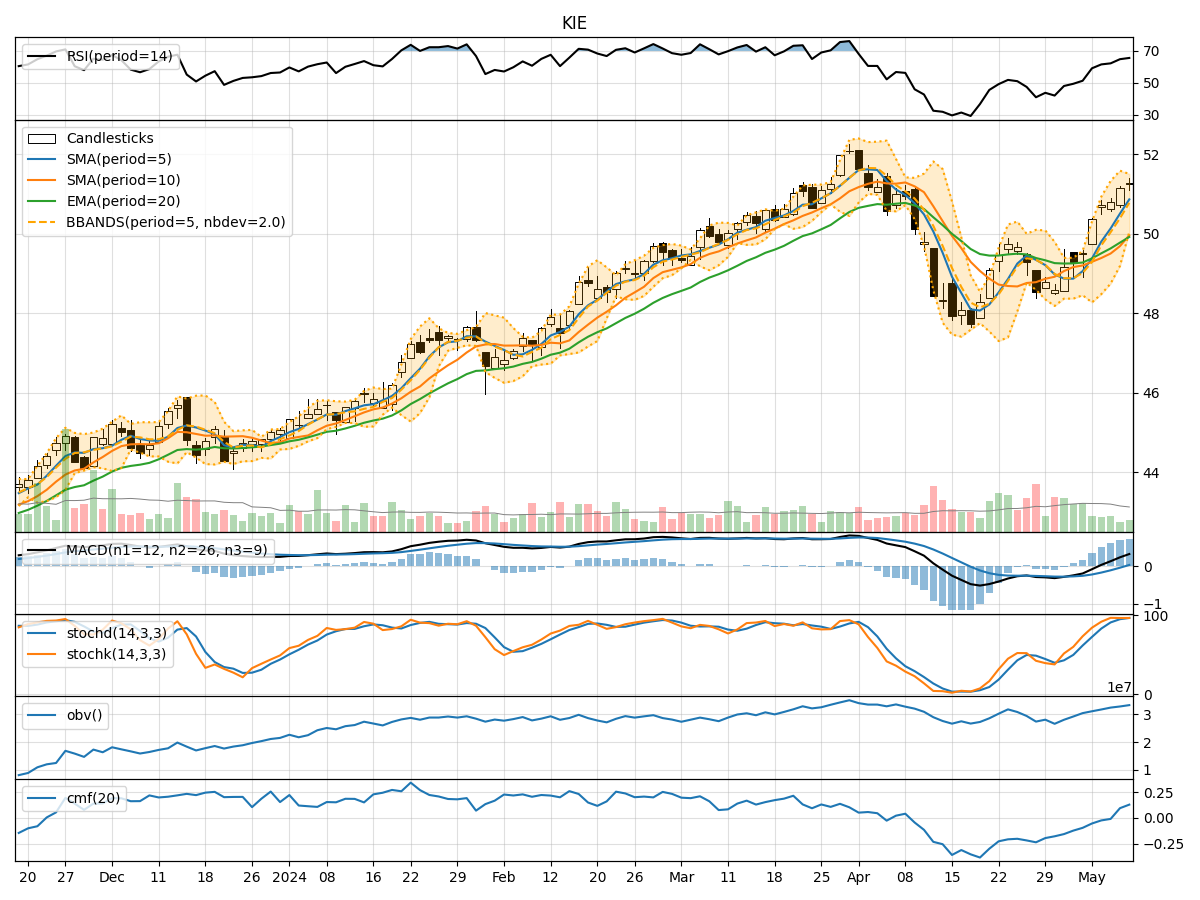
In the last 5 trading days, KIE stock has shown a consistent uptrend in both price and volume. The moving averages have been trending upwards, indicating a bullish sentiment. Momentum indicators such as RSI and Stochastic oscillators are in overbought territory, suggesting a potential pullback. Volatility indicators like Bollinger Bands are expanding, indicating increased price fluctuation. Volume indicators show a positive trend, with On-Balance Volume (OBV) increasing steadily.
Trend Analysis:
- Moving Averages (MA): The 5-day MA has been consistently above the 10-day SMA, indicating a short-term bullish trend. The EMA(20) is also trending upwards, supporting the bullish sentiment.
- MACD: The MACD line has been consistently above the signal line, indicating a bullish trend. The MACD histogram has been increasing, suggesting strengthening bullish momentum.
Momentum Analysis:
- RSI: The RSI is in overbought territory, indicating that the stock may be due for a pullback or consolidation.
- Stochastic Oscillators: Both %K and %D are in the overbought zone, suggesting a potential reversal in the short term.
- Williams %R: The Williams %R is also in the overbought region, signaling a possible downward correction.
Volatility Analysis:
- Bollinger Bands: The widening of the Bollinger Bands suggests increasing volatility in the stock price. This could indicate potential sharp price movements in the near future.
Volume Analysis:
- On-Balance Volume (OBV): The OBV has been steadily increasing over the last 5 days, indicating strong buying pressure and accumulation of the stock.
- Chaikin Money Flow (CMF): The CMF(20) is positive, suggesting that money is flowing into the stock over the medium term.
Conclusion:
Based on the technical indicators and analysis: - Trend: The stock is in a strong upward trend, supported by moving averages and MACD. - Momentum: Momentum indicators suggest a potential pullback or consolidation due to overbought conditions. - Volatility: Increasing volatility could lead to sharp price movements in the near term. - Volume: Strong buying pressure indicated by OBV and positive CMF.
Overall Assessment:
Given the current technical indicators, the stock is likely to experience a short-term pullback or consolidation due to overbought conditions in momentum indicators. However, the overall trend remains bullish supported by moving averages and volume accumulation. Traders may consider taking profits or waiting for a better entry point during the anticipated pullback. Long-term investors can hold their positions with a bullish outlook.