Technical Analysis of KRBN 2024-05-10
Overview:
In analyzing the technical indicators for KRBN over the last 5 days, we will delve into the trend, momentum, volatility, and volume indicators to provide a comprehensive outlook on the possible stock price movement in the coming days. By examining these key aspects, we aim to offer valuable insights and predictions to guide your investment decisions.
Trend Indicators:
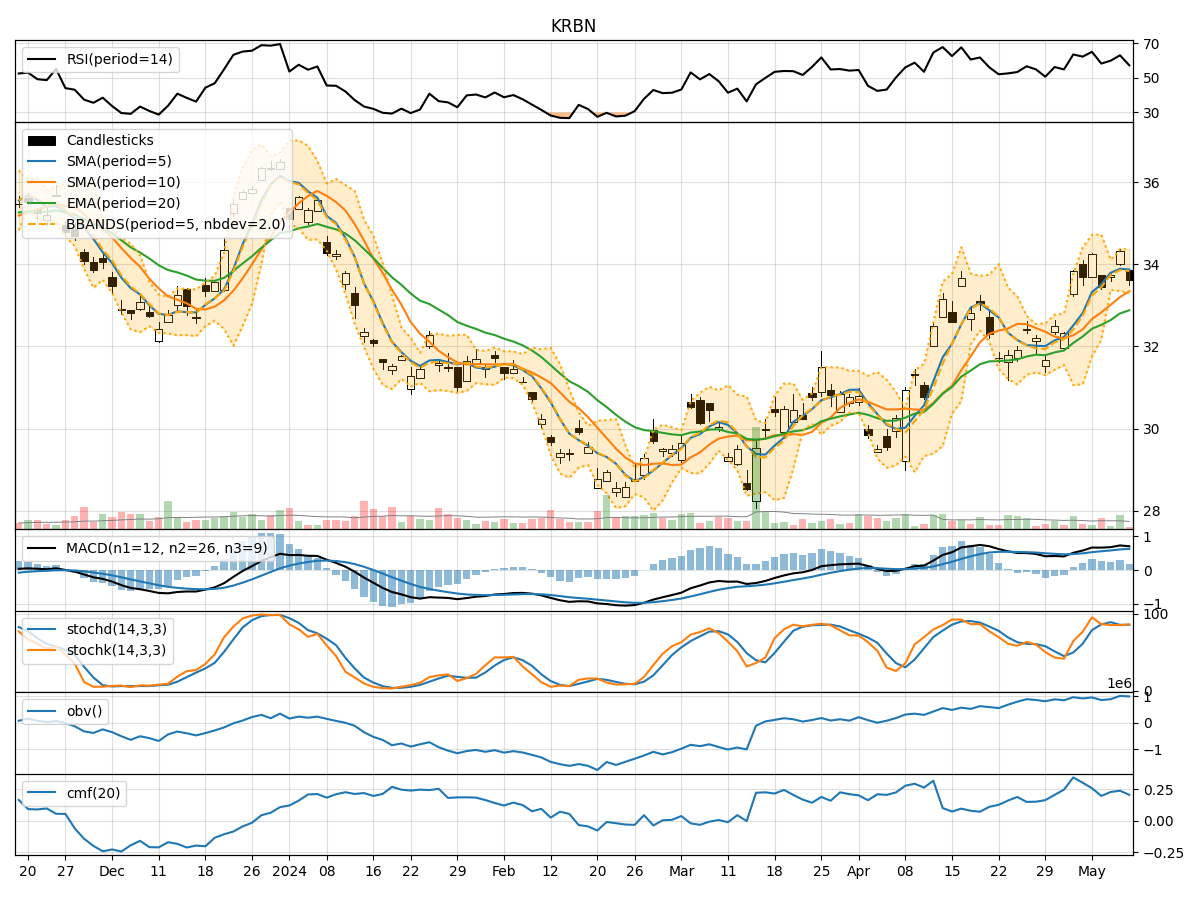
- Moving Averages (MA): The 5-day Moving Average (MA) has been fluctuating around the mid $33 range, indicating a relatively stable trend in the short term.
- MACD: The Moving Average Convergence Divergence (MACD) has shown positive values, suggesting a bullish momentum in the stock price.
- EMA: The Exponential Moving Average (EMA) has been gradually increasing, reflecting a positive trend in the stock price.
Momentum Indicators:
- RSI: The Relative Strength Index (RSI) has been oscillating around the mid-50s to mid-60s, indicating moderate momentum in the stock.
- Stochastic Oscillator: Both %K and %D values have been hovering around the overbought territory, suggesting a potential reversal or consolidation phase.
- Williams %R: The Williams %R has shown mixed signals, moving between oversold and neutral levels.
Volatility Indicators:
- Bollinger Bands: The Bollinger Bands have shown a narrowing of the bands, indicating decreasing volatility and a potential period of consolidation.
- Bollinger %B: The %B indicator has been fluctuating within a narrow range, reflecting a lack of clear direction in price movement.
Volume Indicators:
- On-Balance Volume (OBV): The OBV has shown a slight increase over the last few days, indicating some accumulation of the stock.
- Chaikin Money Flow (CMF): The CMF has been relatively stable, suggesting a neutral sentiment towards the stock.
Key Observations and Opinions:
- Trend: The stock is currently in a bullish trend based on the positive MACD and EMA values.
- Momentum: The momentum indicators suggest a potential reversal or consolidation phase due to overbought conditions.
- Volatility: Decreasing volatility and narrowing Bollinger Bands indicate a period of consolidation.
- Volume: The slight increase in OBV signals some accumulation, but the stable CMF reflects a neutral sentiment.
Conclusion:
Based on the analysis of the technical indicators, the next few days for KRBN are likely to see sideways movement or consolidation as the stock price stabilizes. The bullish trend indicated by the MACD and EMA may face resistance due to overbought conditions highlighted by the stochastic oscillator. Investors should closely monitor key support and resistance levels for potential entry or exit points, considering the neutral sentiment reflected in the volume indicators. It is advisable to exercise caution and wait for clearer signals before making significant trading decisions.