Technical Analysis of LABD 2024-05-10
Overview:
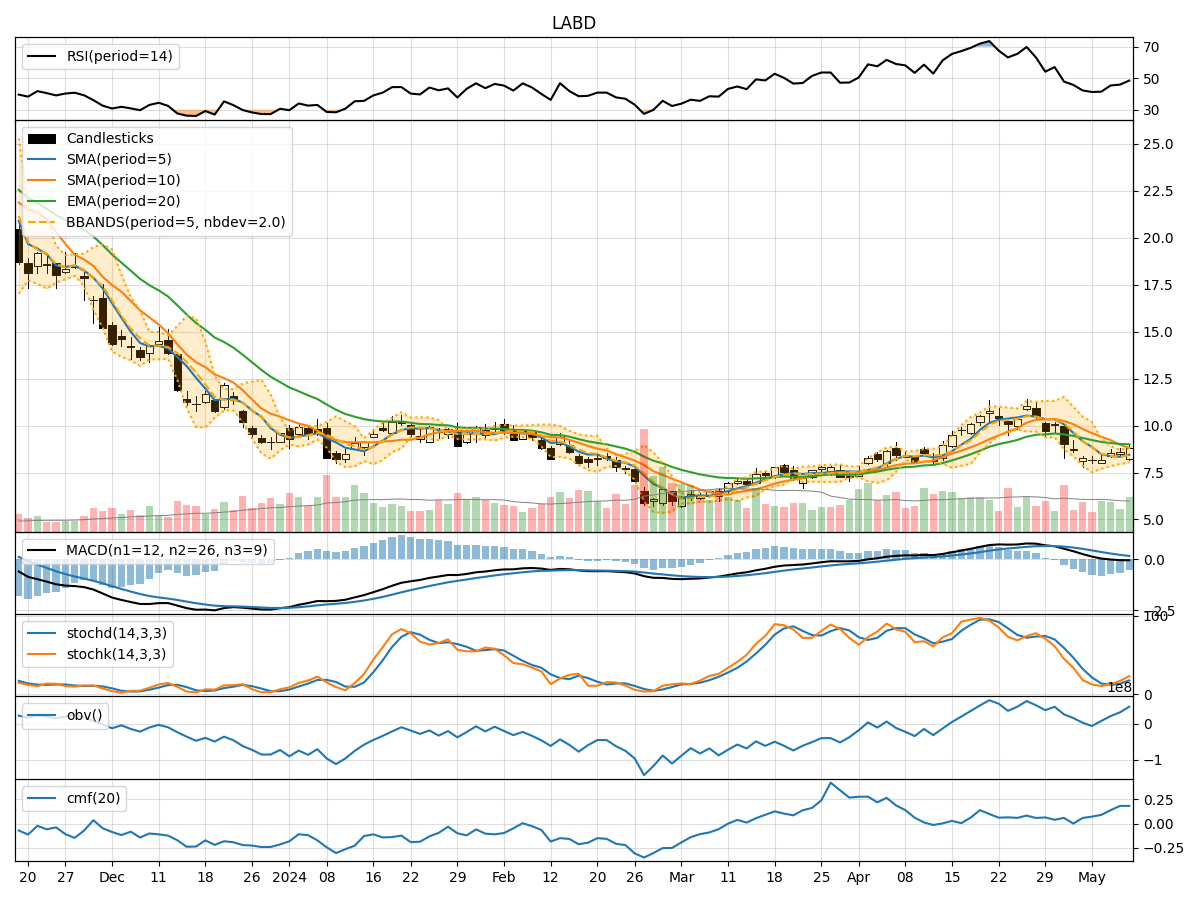
In analyzing the technical indicators for LABD over the last 5 days, we will delve into the trend, momentum, volatility, and volume indicators to provide a comprehensive assessment of the stock's potential price movement. By examining these key factors, we aim to offer valuable insights and predictions for the next few days.
Trend Analysis:
- Moving Averages (MA): The 5-day MA has been consistently below the closing prices, indicating a downward trend in the short term.
- MACD: The MACD line has been below the signal line, suggesting a bearish momentum.
- EMA: The EMA has been declining, further supporting the bearish trend.
Key Observation: The trend indicators point towards a downward trajectory for LABD.
Momentum Analysis:
- RSI: The RSI has been relatively low, indicating bearish momentum.
- Stochastic Oscillator: Both %K and %D have been trending downwards, signaling a bearish sentiment.
- Williams %R: The indicator has been in the oversold territory, reflecting a bearish outlook.
Key Observation: Momentum indicators align with the trend, suggesting a bearish sentiment.
Volatility Analysis:
- Bollinger Bands: The price has been consistently below the upper Bollinger Band, indicating lower volatility.
- Bollinger %B: The %B has been below 1, suggesting a potential oversold condition.
Key Observation: Volatility indicators imply a low volatility environment.
Volume Analysis:
- On-Balance Volume (OBV): The OBV has been increasing, indicating accumulation by investors.
- Chaikin Money Flow (CMF): The CMF has been positive, suggesting buying pressure.
Key Observation: Volume indicators point towards accumulation and buying pressure.
Conclusion:
Based on the analysis of trend, momentum, volatility, and volume indicators, the overall outlook for LABD in the next few days is bearish. The trend and momentum indicators strongly suggest a downward movement, supported by low volatility. However, the positive volume indicators indicate potential buying interest, which could lead to short-term price fluctuations.
Recommendation:
Considering the bearish trend and momentum, investors should exercise caution and consider short-term trading strategies. It is advisable to closely monitor price movements and key support levels. Additionally, keeping an eye on any significant news or market developments that could impact LABD's price is crucial.
In conclusion, the next few days for LABD are likely to see a continuation of the downward trend with potential short-term fluctuations due to buying interest.