Technical Analysis of LQDW 2024-05-10
Overview:
In analyzing the technical indicators for LQDW over the last 5 days, we will delve into the trend, momentum, volatility, and volume indicators to provide a comprehensive outlook on the possible stock price movement in the coming days. By examining these key indicators, we aim to offer valuable insights and predictions to guide investment decisions.
Trend Analysis:
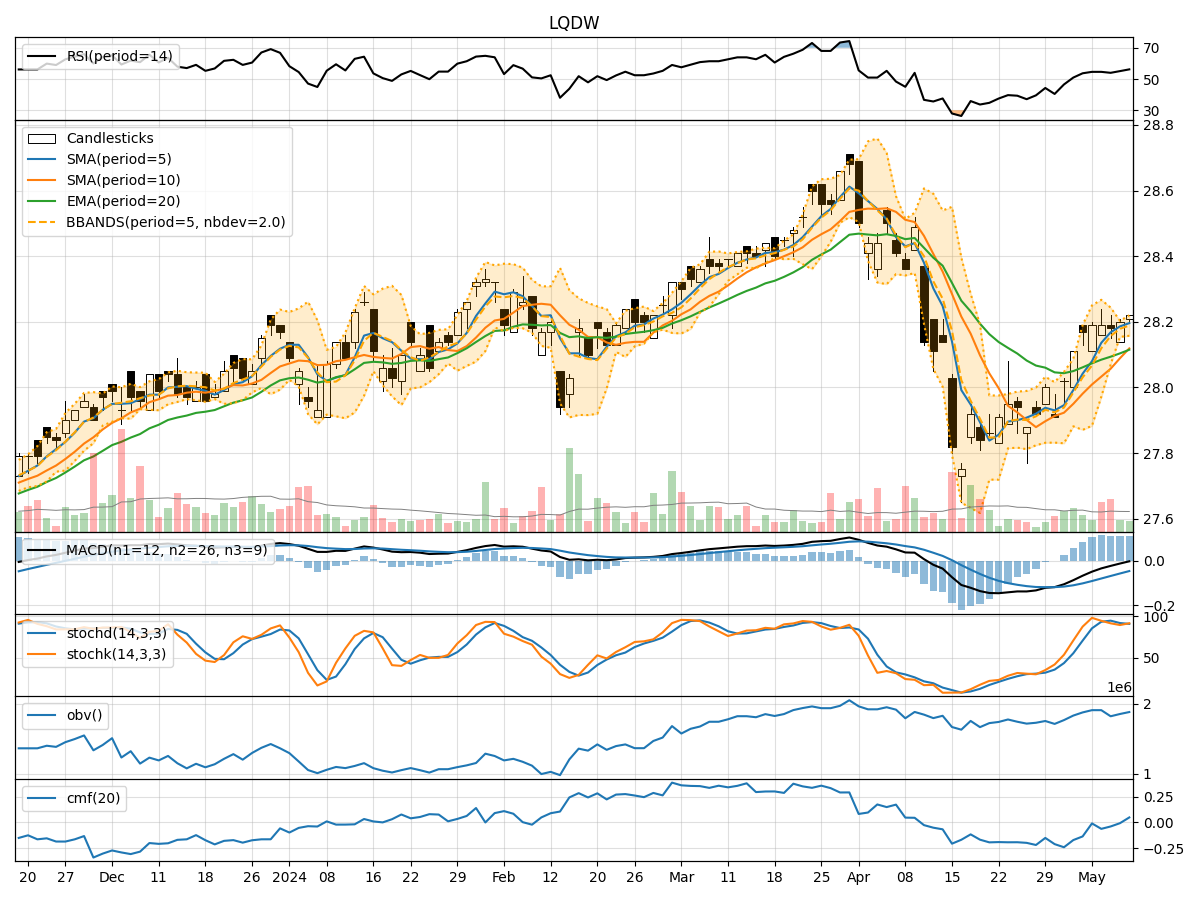
- Moving Averages (MA): The 5-day Moving Average (MA) has been relatively stable around the closing prices, indicating a consistent trend.
- MACD: The Moving Average Convergence Divergence (MACD) has been negative but showing signs of convergence towards the signal line, suggesting a potential reversal.
- EMA: The Exponential Moving Average (EMA) has been slightly increasing, reflecting a gradual uptrend.
Momentum Analysis:
- RSI: The Relative Strength Index (RSI) has been hovering around the neutral zone, indicating a balanced momentum.
- Stochastic Oscillator: Both %K and %D have been fluctuating within a range, suggesting indecision in momentum.
- Williams %R: The Williams %R is also oscillating near the oversold territory, signaling a potential reversal.
Volatility Analysis:
- Bollinger Bands: The Bollinger Bands have been narrowing, indicating decreasing volatility and a possible period of consolidation.
- Bollinger %B: The %B indicator is hovering around the midline, reflecting a balanced volatility level.
Volume Analysis:
- On-Balance Volume (OBV): The OBV has shown mixed movements, indicating uncertainty in volume accumulation.
- Chaikin Money Flow (CMF): The CMF has been negative, suggesting a slight outflow of money from the stock.
Conclusion:
Based on the analysis of the technical indicators, the stock of LQDW is likely to experience sideways movement in the next few days. The trend indicators show a potential reversal in the MACD and a stable EMA, indicating a neutral stance. Momentum indicators suggest a lack of clear direction in momentum, while volatility indicators point towards a period of consolidation. Volume indicators also reflect mixed signals, further supporting the sideways view.
In conclusion, the stock price of LQDW is expected to consolidate in the near term, with limited upside or downside potential. Traders may consider adopting a range-bound strategy until clearer trends emerge in the technical indicators.