Technical Analysis of LSST 2024-05-10
Overview:
In analyzing the technical indicators for LSST stock over the last 5 days, we will delve into the trend, momentum, volatility, and volume indicators to provide a comprehensive outlook on the possible stock price movement in the coming days. By examining these key indicators, we aim to offer valuable insights and predictions for potential investors.
Trend Indicators:
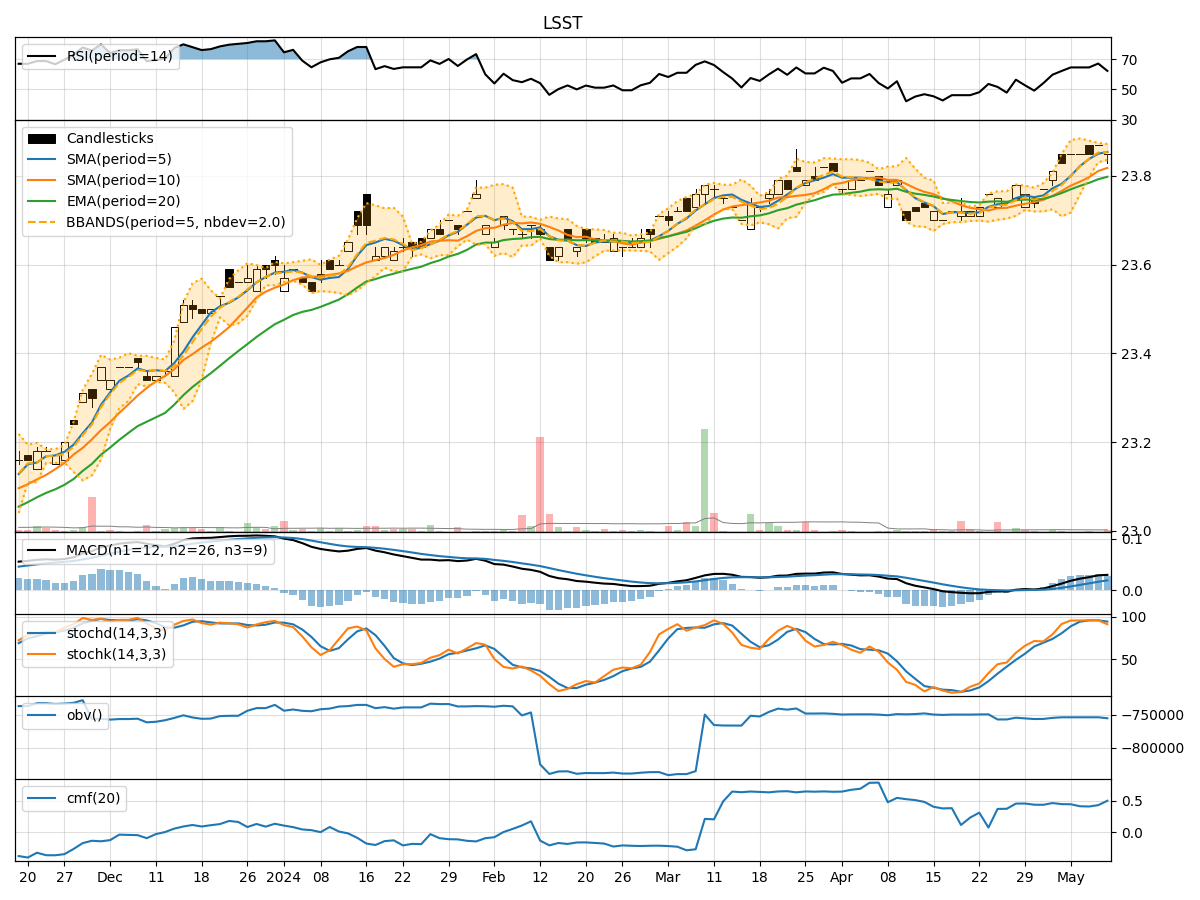
- Moving Averages (MA): The 5-day MA has been consistently above the closing price, indicating a short-term uptrend.
- MACD: The MACD line has been trending upwards, with the MACD histogram also showing positive values, suggesting bullish momentum.
- EMA: The EMA has been steadily increasing, supporting the bullish trend.
Key Observation: The trend indicators point towards a bullish sentiment in the short term.
Momentum Indicators:
- RSI: The RSI has been fluctuating around the overbought territory, indicating strong buying momentum.
- Stochastic Oscillator: Both %K and %D have been relatively high, suggesting an overbought condition.
- Williams %R: The indicator has been consistently in the oversold region, signaling potential buying opportunities.
Key Observation: Momentum indicators reflect an overbought market sentiment.
Volatility Indicators:
- Bollinger Bands (BB): The stock price has been trading within the bands, with the %B indicator hovering around the middle, indicating moderate volatility.
- Average True Range (ATR): The ATR values have been relatively stable, suggesting consistent price movements.
Key Observation: Volatility indicators suggest a stable market environment.
Volume Indicators:
- On-Balance Volume (OBV): The OBV has been relatively flat, indicating a balance between buying and selling pressure.
- Chaikin Money Flow (CMF): The CMF has been positive, signaling inflow of money into the stock.
Key Observation: Volume indicators imply a neutral stance in terms of buying and selling pressure.
Conclusion:
Based on the analysis of the technical indicators, the next few days' possible stock price movement for LSST stock is likely to be upward in the short term. The trend indicators support a bullish outlook, while momentum indicators suggest an overbought condition. Volatility indicators indicate stability, and volume indicators show a neutral stance.
Key Conclusion: The overall assessment points towards an upward movement in the stock price, with potential for further gains in the coming days. Investors may consider taking advantage of the bullish momentum but should also be cautious of the overbought conditions indicated by the momentum indicators.