Technical Analysis of MDCP 2024-05-10
Overview:
In analyzing the technical indicators for MDCP over the last 5 days, we will delve into the trend, momentum, volatility, and volume indicators to provide a comprehensive outlook on the possible stock price movement. By examining these key indicators, we aim to offer valuable insights and predictions for the upcoming days.
Trend Indicators:
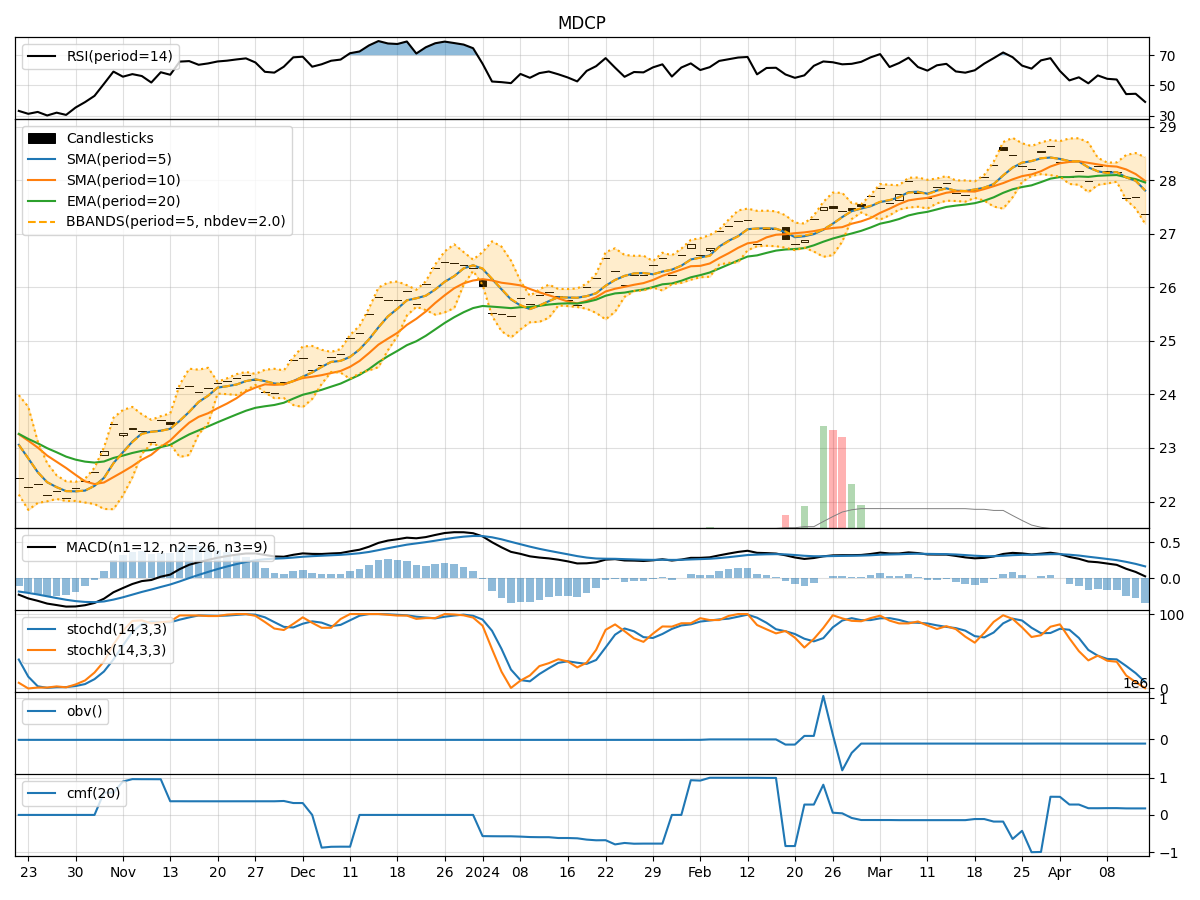
- Moving Averages (MA): The 5-day MA has been consistently above the closing price, indicating a short-term uptrend.
- MACD: The MACD line has been negative but showing signs of convergence towards the signal line, suggesting a potential reversal.
- MACD Histogram: The histogram has been gradually decreasing, indicating a weakening bearish momentum.
Momentum Indicators:
- RSI: The RSI has been fluctuating around the neutral 50 level, suggesting a lack of strong momentum in either direction.
- Stochastic Oscillator: Both %K and %D have been in overbought territory, indicating a potential reversal or consolidation.
- Williams %R: The indicator has been hovering around the oversold region, signaling a possible reversal to the upside.
Volatility Indicators:
- Bollinger Bands: The bands have been narrowing, indicating decreasing volatility and a potential breakout in the near future.
- Bollinger %B: The %B indicator has been fluctuating within a tight range, suggesting a period of consolidation.
Volume Indicators:
- On-Balance Volume (OBV): The OBV has been relatively flat, indicating a balance between buying and selling pressure.
- Chaikin Money Flow (CMF): The CMF has been negative, reflecting a lack of strong buying interest in the stock.
Key Observations and Opinions:
- Trend: The stock is currently in a short-term uptrend based on the moving averages, but the MACD signals a potential reversal.
- Momentum: Momentum indicators are mixed, with RSI neutral, Stochastic overbought, and Williams %R oversold, suggesting a lack of clear direction.
- Volatility: Bollinger Bands are narrowing, indicating a potential breakout, while %B shows consolidation.
- Volume: OBV is flat, indicating a balance between buyers and sellers, while CMF is negative, signaling weak buying pressure.
Conclusion:
Based on the analysis of the technical indicators, the stock price of MDCP is likely to experience sideways consolidation in the upcoming days. The conflicting signals from trend, momentum, volatility, and volume indicators suggest a lack of clear direction. Traders may consider staying on the sidelines until a clearer trend emerges.