Technical Analysis of MDY 2024-05-10
Overview:
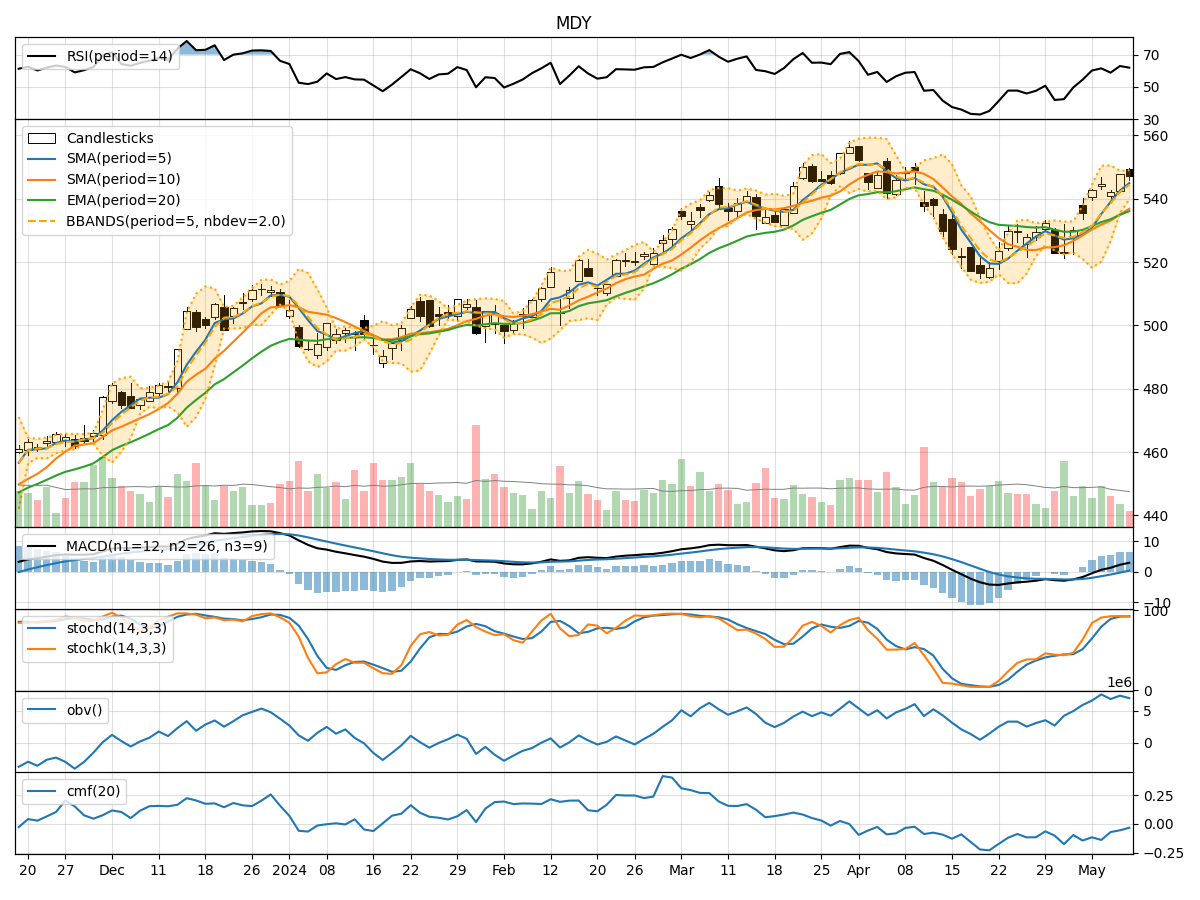
In the last 5 trading days, MDY has shown a mix of price movements and technical indicators. The moving averages have been trending upwards, indicating a bullish trend. The MACD has been positive, suggesting momentum in the upward direction. The RSI has been fluctuating but generally in the overbought territory, indicating potential for a pullback. Bollinger Bands have been narrowing, indicating decreasing volatility. On the volume side, OBV has been relatively stable, while CMF has been negative, suggesting some distribution.
Trend Indicators Analysis:
- Moving Averages (MA): The 5-day MA has been consistently above the longer-term SMAs, indicating a bullish trend.
- MACD: The MACD has been positive, with the MACD line above the signal line, indicating bullish momentum.
Momentum Indicators Analysis:
- RSI: The RSI has been fluctuating but generally in the overbought territory, suggesting a potential pullback.
- Stochastic Oscillator: The Stochastic indicators have been in the overbought zone, indicating a potential reversal.
Volatility Indicators Analysis:
- Bollinger Bands: The Bollinger Bands have been narrowing, indicating decreasing volatility and a potential breakout.
Volume Indicators Analysis:
- On-Balance Volume (OBV): The OBV has been relatively stable, indicating consistent buying interest.
- Chaikin Money Flow (CMF): The CMF has been negative, suggesting some distribution in the stock.
Key Observations:
- The trend indicators suggest a bullish sentiment with moving averages trending upwards.
- Momentum indicators like RSI and Stochastic show overbought conditions, indicating a potential reversal or pullback.
- Volatility indicators point towards decreasing volatility, potentially leading to a breakout.
- Volume indicators show stable buying interest but some distribution as indicated by CMF.
Conclusion:
Based on the analysis of the technical indicators, the next few days' possible stock price movement for MDY could see a pullback or consolidation. The overbought conditions in the momentum indicators and the potential for a breakout due to decreasing volatility suggest a period of consolidation or a minor correction before a potential continuation of the bullish trend. Traders should watch for key support and resistance levels to gauge the direction of the price movement.