Technical Analysis of MIDU 2024-05-10
Overview:
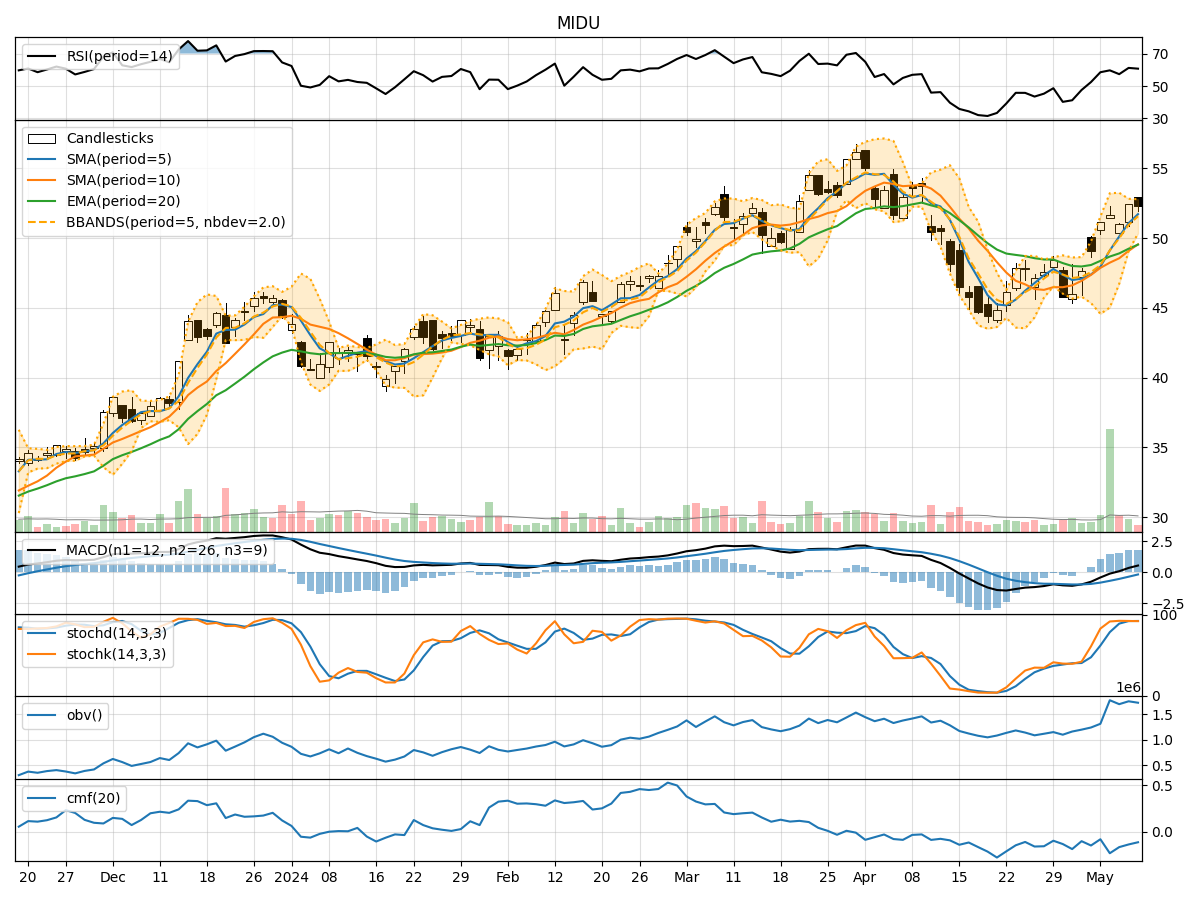
In analyzing the technical indicators for MIDU over the last 5 days, we will delve into the trend, momentum, volatility, and volume indicators to provide a comprehensive outlook on the possible stock price movement. By examining these key factors, we aim to offer valuable insights and predictions for the upcoming days.
Trend Analysis:
- Moving Averages (MA): The 5-day Moving Average (MA) has been consistently rising, indicating a bullish trend in the short term.
- MACD: The MACD line has been positive and increasing, suggesting upward momentum in the stock price.
- EMA: The Exponential Moving Average (EMA) has also been trending upwards, supporting the bullish sentiment.
Key Observation: The trend indicators point towards a bullish outlook for MIDU.
Momentum Analysis:
- RSI: The Relative Strength Index (RSI) has been in the overbought territory, indicating strong buying momentum.
- Stochastic Oscillator: Both %K and %D have been in the overbought zone, signaling a potential reversal.
- Williams %R: The Williams %R is also in the oversold region, suggesting a possible pullback.
Key Observation: The momentum indicators show a mixed signal with potential for a short-term correction.
Volatility Analysis:
- Bollinger Bands (BB): The Bollinger Bands have been narrowing, indicating decreasing volatility.
- BB %B: The %B indicator has been hovering around the middle, suggesting a balanced market sentiment.
Key Observation: Volatility is decreasing, indicating a possible period of consolidation or sideways movement.
Volume Analysis:
- On-Balance Volume (OBV): The OBV has shown a slight increase, reflecting positive volume flow.
- Chaikin Money Flow (CMF): The CMF has been negative, indicating some selling pressure.
Key Observation: Volume indicators suggest a neutral stance with a slight bearish bias.
Conclusion:
Based on the analysis of trend, momentum, volatility, and volume indicators, the overall outlook for MIDU in the next few days is as follows:
- Trend: Upward
- Momentum: Mixed with potential for a correction
- Volatility: Decreasing, signaling consolidation or sideways movement
- Volume: Neutral with a slight bearish bias
Recommendation:
Considering the mixed signals from momentum indicators and the decreasing volatility, it is advisable to exercise caution in the short term. Traders may consider taking profits on existing positions or implementing risk management strategies to navigate potential market fluctuations. Long-term investors can monitor the price action for a clearer trend confirmation before making significant decisions.
Disclaimer:
Remember that market conditions can change rapidly, and unexpected events may impact stock prices. It is crucial to conduct thorough research, consider multiple factors, and consult with financial advisors before making any investment decisions.