Technical Analysis of MJ 2024-05-10
Overview:
In analyzing the technical indicators for MJ stock over the last 5 days, we will delve into the trend, momentum, volatility, and volume indicators to provide a comprehensive outlook on the possible stock price movement in the coming days. By examining these key indicators, we aim to offer valuable insights and predictions to guide your investment decisions.
Trend Analysis:
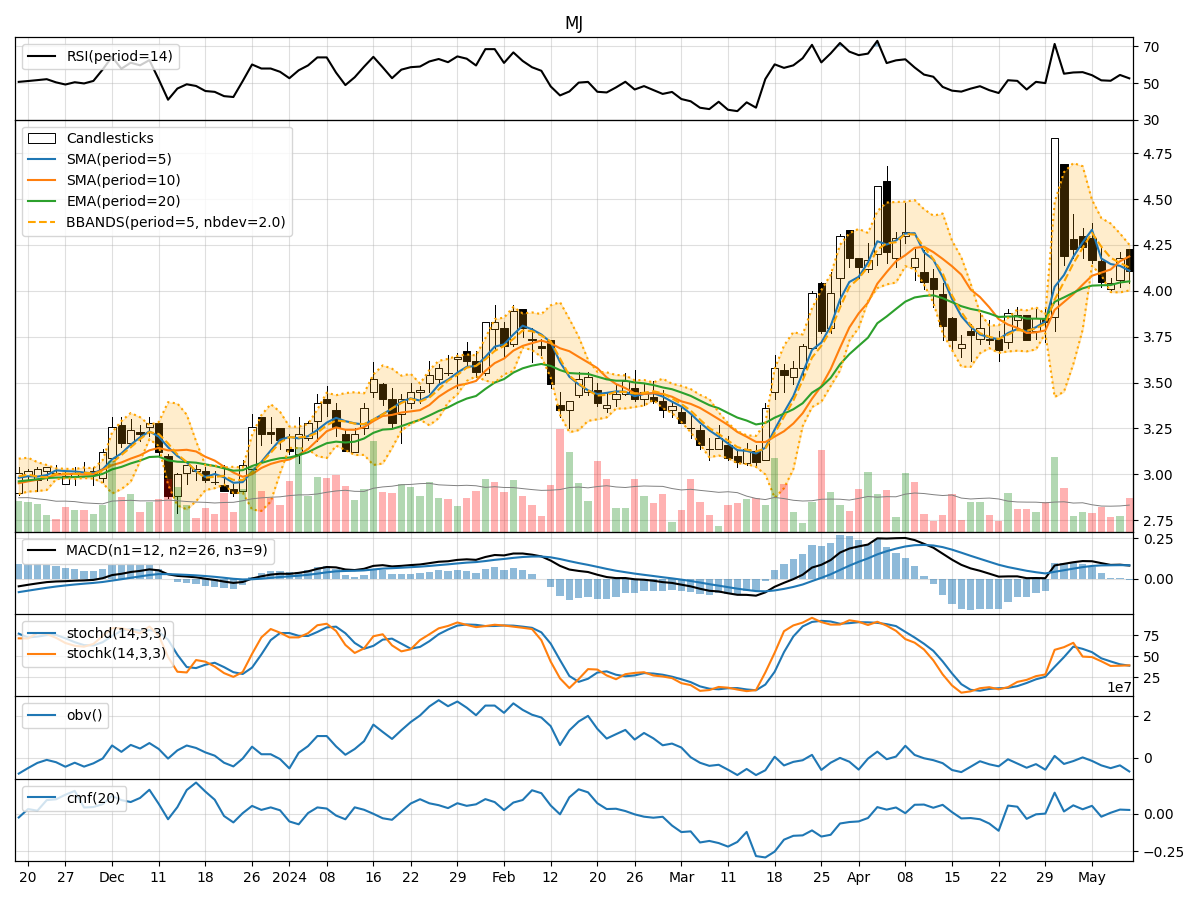
- Moving Averages (MA): The 5-day Moving Average (MA) has been gradually decreasing from 4.332 to 4.110, indicating a short-term bearish trend.
- MACD: The MACD line has been hovering around 0.08, with the MACD Histogram slightly below 0, suggesting a neutral to slightly bearish momentum.
Momentum Analysis:
- RSI: The Relative Strength Index (RSI) has been fluctuating around 50, indicating a lack of strong momentum in either direction.
- Stochastic Oscillator: Both %K and %D have been relatively low, signaling a potential oversold condition but not a clear signal for a reversal.
Volatility Analysis:
- Bollinger Bands (BB): The Bollinger Bands have been narrowing, indicating decreasing volatility in the stock price.
Volume Analysis:
- On-Balance Volume (OBV): The OBV has been negative, suggesting more selling pressure in the stock.
- Chaikin Money Flow (CMF): The CMF has been fluctuating around 0, indicating a balance between buying and selling pressure.
Key Observations:
- The stock is currently in a short-term bearish trend based on the moving averages.
- Momentum indicators show a lack of strong directional momentum.
- Volatility has been decreasing, potentially leading to a period of consolidation.
- Volume indicators suggest more selling pressure in the stock.
Conclusion:
Based on the analysis of the technical indicators, the stock price of MJ is likely to continue its downward trend in the near term. The lack of strong momentum, coupled with decreasing volatility and selling pressure indicated by volume indicators, supports a bearish outlook. Traders and investors should exercise caution and consider waiting for more definitive signals before considering long positions.